So far you have mostly worked from formulas. The exam just as often hands you a picture and asks about a different function: here is , describe ; here is , describe . You do not need a formula for either. You need to read features, and each feature of one graph becomes a feature of the other.
From to : heights become slopes
The height of the graph of the derivative at each is the slope of at that . So read the graph of one feature at a time:
| Graph of | Graph of |
|---|---|
| rising | above the -axis |
| falling | below the -axis |
| a smooth peak or valley (flat tangent line) | crosses the -axis |
| concave up | rising |
| concave down | falling |
| a point of inflection | a peak or valley |
| a straight line with slope | a horizontal segment at height |
| a corner | a jump; no value at that point |
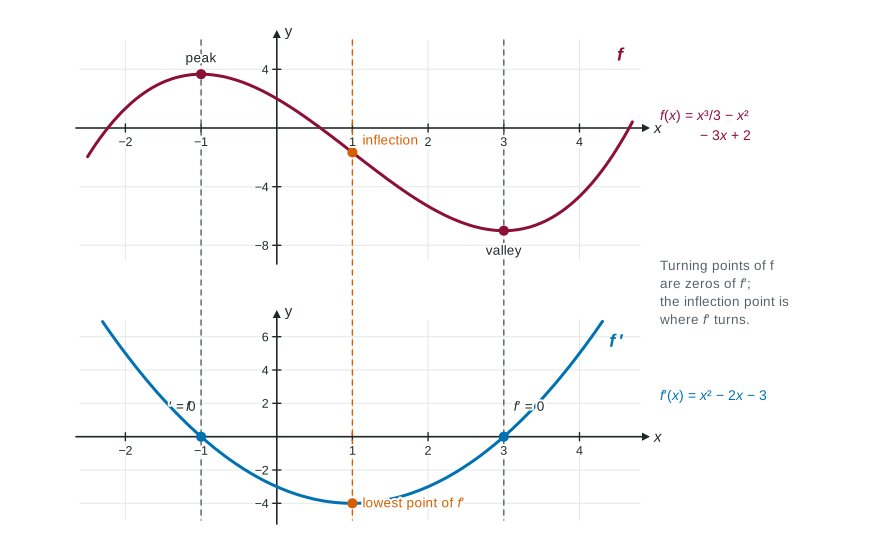
Worked example 1. The graph of is a W shape: valleys at and , a peak at , and inflection points near . Sketch .
Zeros of : at the peak and valleys, .
Signs: falls on and , so there; rises on and , so .
Turns of : at the inflection points of . has a peak near and a valley near .
Check with the formula:
From to : slopes become shapes
Read the same table backward. Given the graph of :
- Where is positive, rises; where negative, falls.
- Where crosses the axis going down, has a peak; going up, a valley. Where touches the axis without crossing, has a flat point but keeps going.
- Where rises, is concave up; where it falls, concave down; where it turns, has a point of inflection.
- Where is constant, is a straight line with that slope.
The graph of does not tell you how high is. Many graphs of , shifted up or down, share one derivative. To place you need one value, such as .
Worked example 2. The graph of is made of segments from to , to , to . Describe .
crosses zero going up at (valley of ) and going down at (peak of ).
On , rises: is concave up. On , : is a straight segment with slope 2. On , falls: concave down.
is the slope of the graph of : , then , then . At and the slope of jumps, so does not exist there.
One level further down
The same pattern links and : the height of the graph of is the slope of . So from a graph of you can read as a slope, and say where is positive (wherever is rising).
A symmetry shortcut
Reflecting a graph across the -axis reverses every slope. So if is even (symmetric about the -axis, like ), then is odd (symmetric about the origin), and the reverse holds too.
Common sketching mistakes
- Copying the shape of . The graph of does not look like shifted; peaks of are zeros of .
- Putting the peaks of at the peaks of . The peaks of are the steepest points of , its inflection points.
- Smoothing over a corner. A corner in is a jump in .