Sketching f, f' and f''
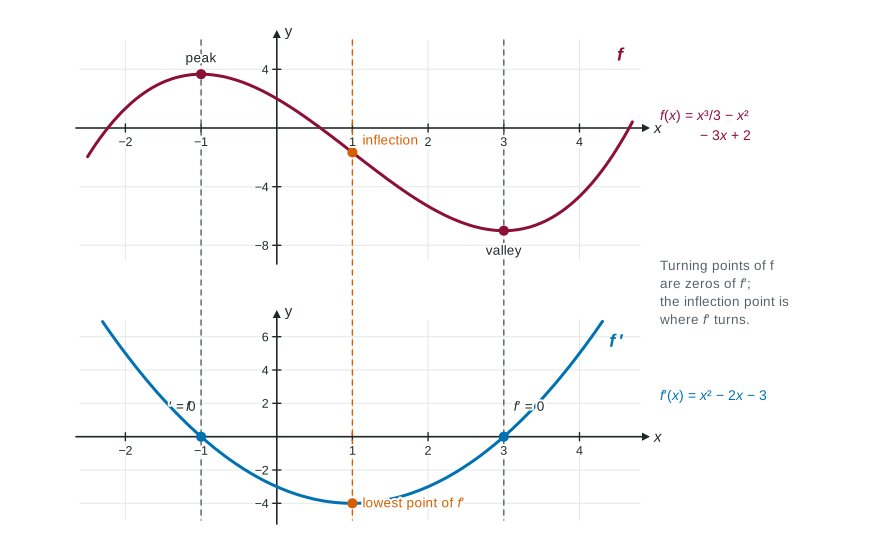
Sketch a derivative feature by feature: where f rises, f′ is positive; where f is flat at a peak or valley, f′ crosses zero; where f is concave up, f′ rises; where f inflects, f′ turns; where f has a corner, f′ jumps.
Part 1 · Hook
Why this matters
Part 2 · Before you start
What this builds on
Part 3 · Prerequisite check
Quick check before you start
1. If is concave up on an interval, then is
- increasing there
- positive there
- decreasing there
- zero there
Show the answer
Concave up: , so increases.
- Correct: increasing there:
- positive there:
- decreasing there:
- zero there:
2. At a relative maximum of a differentiable ,
- changes from positive to negative
- changes from negative to positive
- is positive
- is undefined
Show the answer
The First Derivative Test.
- Correct: changes from positive to negative:
- changes from negative to positive:
- is positive:
- is undefined:
3. on means is
- increasing on
- concave up on
- positive on
- decreasing on
Show the answer
The sign of gives direction.
- Correct: increasing on :
- concave up on :
- positive on :
- decreasing on :
Part 4 · See it
See it first
Part 5 · Step by step
How it works, step by step
- is rising (falling) on an intervalthe graph of is above (below) the -axis there
- has a peak or valley with a flat tangent linethe graph of crosses the -axis there
- is concave up (down)the graph of is rising (falling)
- has a point of inflectionthe graph of has a peak or valley there
- has a cornerthe graph of jumps, with no value at that point
Part 6 · Key ideas
Key ideas
- Read a graph of for features, not values: where it rises, falls, peaks, bends. Each feature becomes a feature of the graph of the derivative.
- (sign of slope) (sign of value). (concavity) (rising or falling). Inflection of peak or valley of .
- Going the other way, from to : zeros of where its sign changes are extrema of ; turns of are inflection points of ; a constant means is a straight line.
- The same pattern links and : the slope of the graph of is .
Part 7 · Misconception
A common mistake
The wrong idea: The graph of looks like the graph of , shifted or flattened.
What actually happens: records slopes, not heights. A peak of is a zero of , and a peak of is the steepest point of , an inflection point. Build the sketch feature by feature: signs first, then where rises or falls.
Part 8 · Check yourself
Check yourself
Exam-style questions. Anything you miss goes into your review queue.
Graph
The graph of
1. Where does the graph of cross or touch the -axis?
- At , and
- At , and
- At and
- At and
Show the answer
where the graph of has a flat tangent line: at its turning points , , . Check:
- Correct: At , and : The peaks and valleys of , where its tangent lines are flat.
- At , and : Those are the zeros of , where the graph of crosses the axis.
- At and : Those are the inflection points of , where turns.
- At and : The ends of the graph are not where is flat.
2. On which intervals is the graph of above the -axis?
- and
- and
- and
Show the answer
exactly where is increasing: on and .
- and : Here falls, so .
- : There is concave down, which is about the slope of , not its sign.
- and : falls on , so is negative there.
- Correct: and : Where rises, its derivative is positive.
3. Where does the graph of have its relative maximum and minimum?
- At the relative extrema of , , ,
- At the endpoints and
- At the inflection points of ,
- At the zeros of , and
Show the answer
changes sign at , where changes concavity. There changes from increasing to decreasing or back, so the graph of peaks at and bottoms out at .
- At the relative extrema of , , , : There ; those are zeros of the graph of the derivative, not its turns.
- At the endpoints and : An endpoint is not a relative extremum.
- Correct: At the inflection points of , : turns where its own slope changes sign, which is where changes concavity.
- At the zeros of , and : The zeros of say nothing about .
4. At , what does the graph of look like?
- Below the -axis and rising
- Below the -axis and falling
- Above the -axis and falling
- Above the -axis and rising
Show the answer
At the graph of is going down and bending down. So () and is decreasing ().
- Below the -axis and rising: is concave down at , so is falling.
- Correct: Below the -axis and falling: is falling () and concave down ( decreasing) at .
- Above the -axis and falling: is decreasing at , so is negative.
- Above the -axis and rising: Both features are reversed.
5. The graph of is a line with positive slope that crosses the -axis at . Which describes the graph of ?
- A parabola opening upward with its vertex at
- A parabola opening downward with its vertex at
- A line with positive slope through
- A cubic with a point of inflection at
Show the answer
with , so for some constant : decreasing then increasing, concave up, vertex at .
- Correct: A parabola opening upward with its vertex at : before 1 and after (a minimum at 1), and increasing means concave up.
- A parabola opening downward with its vertex at : That would need to go from positive to negative.
- A line with positive slope through : A line is here; is one degree higher.
- A cubic with a point of inflection at : is a positive constant, so the concavity never changes.
6. The graph of is concave down on . What must be true of the graph of there?
- It is below the -axis
- It is concave down
- It is increasing
- It is decreasing
Show the answer
Concave down on means the slopes of decrease there: the graph of the derivative is decreasing.
- It is below the -axis: The sign of gives the direction of , not its concavity.
- It is concave down: The concavity of is about .
- It is increasing: That would be concave up.
- Correct: It is decreasing: Concave down means , so is decreasing.
Part 9 · Summary
Summary
Part 10 · Up next
What comes next
Part 11 · Connections