You now know where a function rises and where it falls. Put two intervals side by side and a peak or valley appears between them. The First Derivative Test is that observation, stated carefully enough to use as a justification. It is one of the most scored sentences on the whole exam.
The test
Let be a critical point of , and let be continuous at .
- If changes from positive to negative at , then has a relative maximum at . The graph rises up to , then falls.
- If changes from negative to positive at , then has a relative minimum at . The graph falls, then rises.
- If does not change sign at , then has no relative extremum at . The graph keeps going the same way.
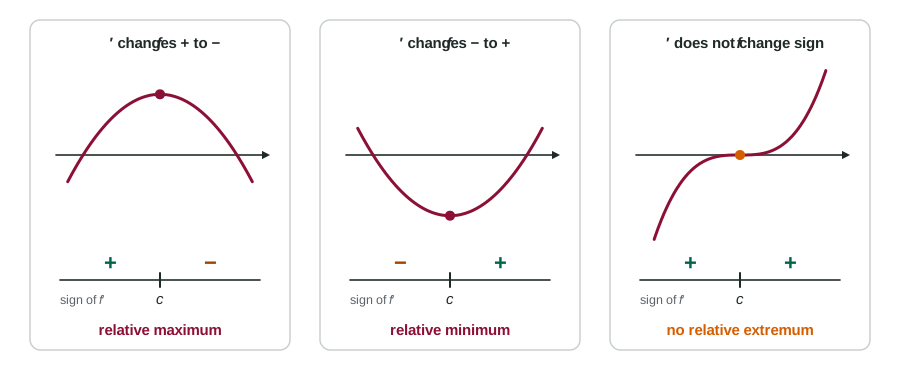
Notice what the test does not use: the value . It works the same at a point where and at a corner or cusp where does not exist. What matters is the sign just before and just after.
Sign charts
A sign chart is a number line marked with the critical points and the sign of on each interval between them. It is a good way to organize the work:
Worked example 1. Find the relative extrema of .
Test values: , , . Sign chart: , then after , then after .
At , changes from positive to negative: relative maximum,
At , changes from negative to positive: relative minimum,
But the chart is scratch work. The scoring guidelines do not accept a sign chart by itself as a justification. Write the sentence: " changes from positive to negative at , so has a relative maximum there."
Points where does not exist
Worked example 2.
Critical points: (numerator zero) and ( undefined; is defined and continuous there).
Signs: for , both and are negative, so . For , . For , .
So has a relative maximum at ( changes from positive to negative at a cusp) and a relative minimum at .
Zeros that are not extrema
A squared factor in is the usual reason a critical point is not an extremum. For :
The factor is never negative, so the sign of is the sign of . At , is negative on both sides: no extremum, even though . At , changes from negative to positive: a relative minimum.
Reading the test from a graph of
| What the graph of does at | What has at |
|---|---|
| Crosses the axis going down ( to ) | relative maximum |
| Crosses the axis going up ( to ) | relative minimum |
| Touches the axis and turns back (no sign change) | no extremum |
| Has a peak or valley above or below the axis | no extremum (that is about concavity) |
The sentence to write
Name the function, name the point, give the direction of the change:
" changes from negative to positive at , so has a relative minimum at ."
Answers that lose the point: "" (no sign change), "it changes sign" (which function? which direction?), or "the graph crosses the axis" (which graph?). And remember this test is local: it finds relative extrema, not absolute ones. For the absolute maximum on an interval, you need the next topic.