Most graphs you have drawn so far show one quantity against another: against . A parametric function adds a third quantity that is not drawn at all. It is the clock that tells each point when to appear. This page shows how to read and draw such curves, and why they can do things an ordinary graph cannot.
A parameter runs the show
A parametric function is a pair of functions of one input, written . The input is called the parameter. For each allowed , the function gives a horizontal position and gives a vertical position, so the pair is one point of the plane.
Think of as time. A drone's log might say that after seconds it is meters east and meters north of where it took off. The flight path is the set of all points . Time does not show on the picture, but it decides the order of the points.
From a table to a curve
The surest way to sketch a parametric curve is a table. Choose several values of , compute and , plot the points, and join them in order of increasing .
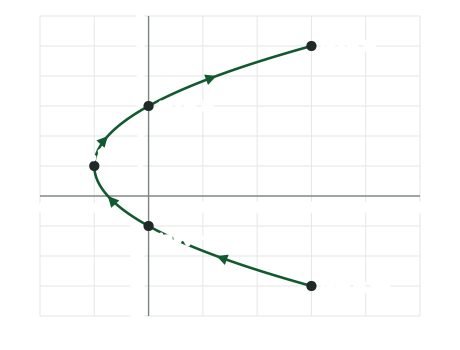
Worked example 1. Sketch , for .
For example,
Direction of travel
A parametric curve comes with a direction: the order in which the points are traced as increases. Mark it with arrows. You can read the direction from the two functions separately:
- where is increasing, the point moves right; where it is decreasing, the point moves left;
- where is increasing, the point moves up; where it is decreasing, the point moves down.
In Worked example 1, increases for every , so the point climbs the whole time, while falls and then rises.
Curves that are not graphs of functions
Both and are functions of : one input, one output. The curve they make is a different matter. In Worked example 1, happens at and at , with and . One -value has two -values, so the curve is not the graph of a function of . A parametric curve may also cross itself, when two different values of land on the same point.
Same path, different parameter
Different parametric functions can trace the same set of points. The functions for and for both trace the parabola from to . The second one just gets there with smaller parameter values. Replacing with (and adjusting the interval) traces the same path backward.
Writing as a function of
When is simple to solve for , you can remove the parameter and get an equation in and alone.
Worked example 2. Write as a function of for , .
Solve for : subtract 1, then divide by 2, so .
Substitute into : . The curve is a parabola with vertex at , the point where .
Graph against the parameter, or curve in the plane?
| Picture | Horizontal axis | Vertical axis | What it shows |
|---|---|---|---|
| Graph of | when the point moves right or left | ||
| Graph of | when the point moves up or down | ||
| Parametric curve | the path itself, with arrows for the order |
Keep these apart. A common slip is to draw against and call it the curve.