An exponential function , with , and , multiplies its output by for every unit of input. That one fact decides the shape of every exponential graph: which way it goes, how it bends, and the line it creeps toward. This page reads those features off the formula and writes them the way the exam scores them.
Growth and decay
The number is the output at , since . The base decides the direction:
- : each step multiplies by more than . With , the function is increasing: exponential growth.
- : each step multiplies by less than . With , the function is decreasing: exponential decay.
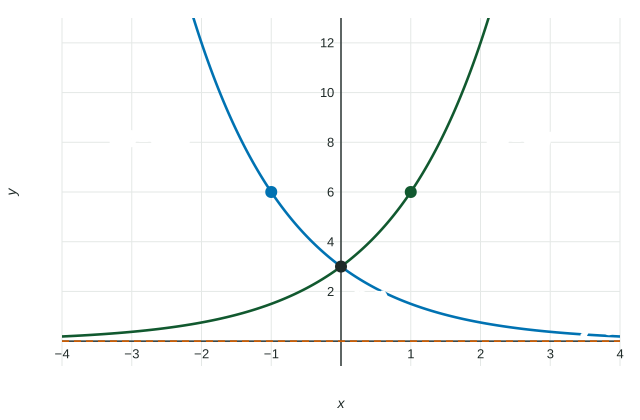
Because every step multiplies by the same , the outputs never turn around. An exponential function is increasing everywhere or decreasing everywhere, so it has no local maximum or minimum. It also has one concavity: concave up when , concave down when (a reflection across the -axis). So it has no point of inflection either.
In the figure, is decreasing and concave up. Its average rates of change over equal intervals are negative but get closer to : the graph falls, more and more gently. In precalculus words: is decreasing, and the rate of change of is increasing.
Horizontal asymptotes and limit notation
Multiplying by again and again makes a number as close to as you like, without reaching it. So one side of every exponential graph approaches a horizontal asymptote. The readers expect limit notation, written in full:
| Function | One side | Other side |
|---|---|---|
| (growth) | ||
| (decay) |
Adding a constant moves the asymptote. For , the exponential part approaches , so approaches , and the asymptote is .
Worked example 1. Describe .
The base and : is decreasing and concave up.
Right side: , so . Left side: grows without bound, so .
The exponential part takes every positive value, so the range of is . The asymptote value itself is never reached.
Spotting a shifted exponential in a table
If the outputs do not have a constant ratio, try subtracting a constant first. The outputs at have ratios that change, but are , which double each step. So : an exponential function shifted up , with asymptote .
Growth factors and percent change
In context, the base is called the growth factor (or decay factor). A percent change of (written as a decimal) gives .
Worked example 2. A town of people grows a year; a car loses of its value a year. Write each model.
Town: each year is of the last, so and .
Car: each year keeps of the value, so and .
Read it backward too: has , an decrease each unit.
The natural base
One base turns up so often in science and finance that it has its own letter: , the natural base. is an exponential function like any other, increasing and concave up with . Your calculator has an key; use it rather than typing , which changes the third decimal place.