
Two models of the same data can both look close on a graph. One might be a line and the other an exponential function, and the eye cannot always tell which is better. The tool for deciding is the residual: how far the model misses each data point. This page defines residuals, reads residual plots, and uses them to choose between competing models, a skill the calculator section of the exam and Question 2 both test.
Residuals
For each data point,
- A positive residual means the actual value is above the prediction: the model underestimates there.
- A negative residual means the actual value is below the prediction: the model overestimates there.
- A residual of means the model hits the data point.
The size of a miss can also be stated as the error, predicted minus actual, or as the absolute error . Keep the order straight: a question that asks for the residual expects actual minus predicted.
Worked example 1. A plant is cm tall at weeks to . Model predicts and model predicts . Compare them.
Residuals of : , , , .
Residuals of : , , , .
Every residual of is closer to , and its largest miss is cm against cm for . Model fits better. Its residuals are slightly negative, so it slightly overestimates.
Residual plots
A residual plot graphs each residual against its input. It magnifies the misses so you can see their pattern.
| What the residual plot shows | What it means |
|---|---|
| Small residuals scattered above and below , no pattern | The model has the right shape: appropriate |
| A U shape (positive, negative, positive) | The data bend upward away from the model: try a concave-up model |
| An upside-down U (negative, positive, negative) | The data bend downward: try a concave-down model |
| Residuals that grow steadily in size | The model misses more and more as the input grows |
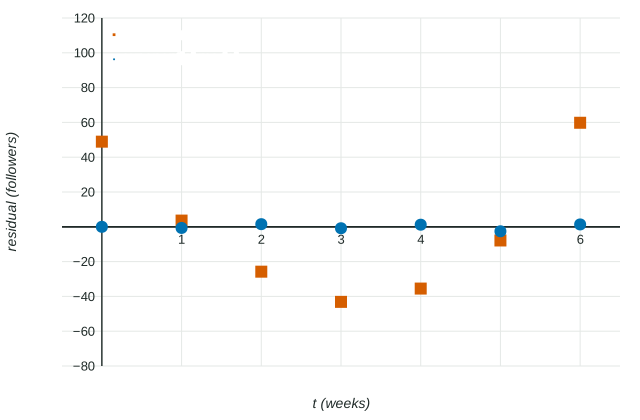
Worked example 2. A channel had followers at weeks to . Use regression and residuals to choose between a linear and an exponential model.
Linear regression gives
Exponential regression gives
Conclusion with reasons: " is more appropriate, because its residuals are small and show no pattern, while the residuals of form a U, so the data curve upward away from the line." Then predict with the stored : followers.
Most graphing calculators can draw a residual plot straight from a regression. Store the regression first, then plot the residual list against the input list.
Mixed signs are not enough
A common wrong answer is "the linear model fits, because some residuals are positive and some are negative." Almost any model's residuals have both signs. What matters is whether they fall in a pattern. Residuals of one sign across an interval also say something: if every residual on is positive, the model underestimates on that whole interval.
Error beyond the data
Residuals exist only where there is data. Past the last data point, a model's error is unknown and usually grows: a small error in the base of an exponential model is multiplied again with every unit of input. Choose the model with the best residuals, and still say that predictions far beyond the data are less reliable.