When a quantity changes by the same factor over equal stretches of time, an exponential model describes it: a phone losing value, a medicine leaving the blood, a gym gaining members. This page builds such models three ways, rewrites them for other time units, and uses them to predict and to find when a value is reached. It is the content of Question 2 whenever the context is exponential.
Reading and in context
is the initial value, the amount when . is the growth factor per unit of : each unit, the amount is multiplied by . A factor means a increase per unit; means the amount keeps , a decrease. Always say what is and what one unit of is.
Three ways to build the model
| You know | Find and by |
|---|---|
| The initial value and the percent change | = initial value, |
| Two points | The ratio of the outputs over the gap in inputs: |
| Many data points that fit only roughly | Exponential regression on the calculator |
Worked example 1 (two points). A phone costs new and is worth after years. Find .
.
Over the -year gap the value is multiplied by . That is two yearly factors: .
Take the square root (rational exponent ): . So : the phone keeps of its value each year.
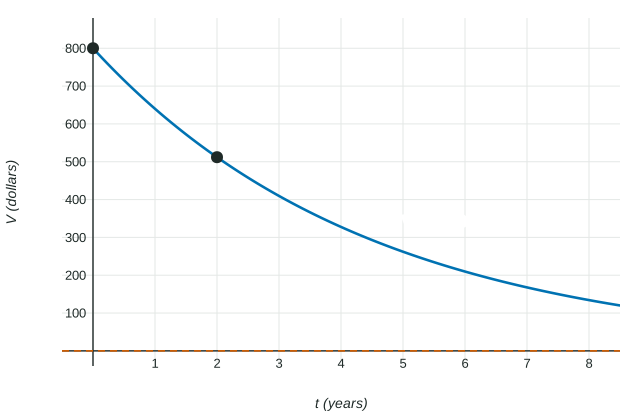
If neither point is at , find the same way, then work back to . Through and : , so , and gives .
With real data, use exponential regression: enter the lists, run the regression, and store and at full precision. For the medicine data on the practice page, the calculator gives , a decrease of about per hour.
Other time units
Rational exponents convert the factor to another unit. If the yearly factor is , the monthly factor satisfies , so . The model can be written
Do not split the percent: a year is not a month, because each month builds on the last. Likewise, a week is a daily factor of , not .
A half-life means the amount halves every units: . After years with a -year half-life, grams becomes grams.
Predicting and solving
Worked example 2. For , find and the time when the phone is worth .
Prediction:
Solving: graph and and find the intersection with the calculator: , so about years. (Store the value; do not round first.)
Where the model can be trusted
A model built from data is supported near that data. Between data points, predictions are usually good. Far past the last data point, nothing in the data shows the pattern continues: the phone may stop losing value at a scrap price, and the body may clear a medicine differently once little is left. Say this with the numbers: "the data stop at , so a prediction at is not supported by the data." In context, the domain may also have a hard edge, such as a value that cannot fall below a floor.