Competing Function Model Validation
Residuals (actual minus predicted) measure how far a model misses each data point.
Part 1 · Hook
Why this matters
Part 2 · Before you start
What this builds on
Part 3 · Prerequisite check
Quick check before you start
1. Over equal steps, outputs go . What fits?
- Exponential, ratio
- Linear, slope
- Linear, slope
- Quadratic
Show the answer
- Correct: Exponential, ratio :
- Linear, slope :
- Linear, slope :
- Quadratic:
2. What does a calculator regression do?
- Finds the constants of a chosen model type that fit all the data closest
- Finds a model through exactly two points
- Chooses the model type for you
- Rounds the data
Show the answer
You choose the type; the regression chooses the constants.
- Correct: Finds the constants of a chosen model type that fit all the data closest:
- Finds a model through exactly two points:
- Chooses the model type for you:
- Rounds the data:
Part 4 · See it
See it first
Part 5 · Step by step
How it works, step by step
- For each data point, subtract the prediction from the actual valuethe residuals: positive where the model underestimates, negative where it overestimates
- Plot the residuals against the inputa residual plot
- Small residuals with no patternthe model is appropriate; a curve or trend means it misses the shape of the data
Part 6 · Key ideas
Key ideas
- Residual actual predicted. Positive: the model underestimates. Negative: it overestimates.
- An appropriate model has a residual plot scattered around 0 with no pattern; a U or a trend shows the model has the wrong shape.
- Error can also be stated as predicted actual, or as an absolute error . Compare competing models by their residuals.
Part 7 · Misconception
A common mistake
The wrong idea: If a model's residuals are both positive and negative, the model fits well.
What actually happens: Mixed signs are expected; what matters is the pattern. Residuals that go positive, negative, positive in order show a curve the model misses.
Part 8 · Check yourself
Check yourself
Exam-style questions. Anything you miss goes into your review queue.
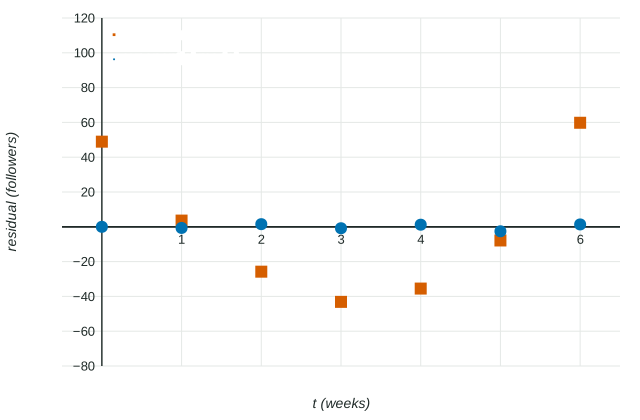
Graph
Residual plots for two models of follower counts
1. Based on the residual plots, which model is more appropriate for the data, and why?
- , because its residuals are both positive and negative
- , because its residuals are small and show no pattern
- , because its residuals form a smooth curve
- , because its residuals are mostly above
Show the answer
An appropriate model leaves residuals scattered around with no pattern. The residuals of form a U: positive, then negative, then positive, which means the data bend away from the line. The residuals of stay near with no pattern.
- , because its residuals are both positive and negative: Mixed signs are fine only without a pattern; these form a U.
- Correct: , because its residuals are small and show no pattern: Small, patternless residuals.
- , because its residuals form a smooth curve: A curved pattern in the residuals is the sign of a poor model.
- , because its residuals are mostly above : The residuals of are positive and negative.
2. The residual of at is positive. What does that mean?
- predicts more followers than the channel really had at
- The channel gained followers at
- predicts fewer followers than the channel had at
- is increasing at
Show the answer
Residual actual predicted. A positive residual means actual predicted: the model underestimates there.
- predicts more followers than the channel really had at : That is a negative residual, an overestimate.
- The channel gained followers at : A residual compares the model to the data; it is not a change in followers.
- Correct: predicts fewer followers than the channel had at : Actual minus predicted is positive: an underestimate.
- is increasing at : The sign of a residual says nothing about whether the model is increasing.
Table
Two models of a growing plant
| (weeks) | 0 | 1 | 2 | 3 |
|---|---|---|---|---|
| Actual height (cm) | 50 | 62 | 78 | 97 |
| Model (cm) | 48 | 63 | 78 | 93 |
| Model (cm) | 50 | 62.5 | 78.1 | 97.7 |
3. What is the residual of model at ?
No calculator. Type the exact value (a fraction, π, e or a root is fine), in cm.
Show the answer
Residual actual predicted cm. Model underestimates at .
- Answer: 4 cm
4. Which model fits the data in the table better, and why?
- , because its residuals are all closer to
- , because it matches the data exactly at
- , because its residuals are whole numbers
- , because its predictions are larger
Show the answer
The residuals of are ; those of are . Every residual of is at least as close to , and the largest error of ( cm) is smaller than the largest of ( cm).
- Correct: , because its residuals are all closer to : Smaller errors at each time.
- , because it matches the data exactly at : One exact match does not outweigh larger errors elsewhere.
- , because its residuals are whole numbers: Whole numbers are not a measure of fit.
- , because its predictions are larger: Larger predictions are better only where the model underestimates.
5. How is a residual defined in this course?
- Predicted value minus actual value
- Actual value divided by predicted value
- Actual value minus predicted value
- The difference between two predictions
Show the answer
A residual is actual minus predicted. The error of a prediction can be stated as predicted minus actual, or as the absolute value of the difference.
- Predicted value minus actual value: This is the opposite sign; it is the error of the prediction, not the residual.
- Actual value divided by predicted value: A residual is a difference, not a ratio.
- Correct: Actual value minus predicted value: Positive when the model underestimates.
- The difference between two predictions: A residual compares a prediction with data.
6. A model predicts visitors, and visitors come. What is the absolute error of the prediction?
No calculator. Type the exact value (a fraction, π, e or a root is fine), in visitors.
Show the answer
The absolute error is
- Answer: 8 visitors
Part 9 · Summary
Summary
Part 10 · Up next
What comes next
Part 11 · Connections