Every few years the tropical Pacific Ocean shifts its pattern of winds and warm water. The shift brings floods to deserts, droughts to rainforests, crashes in one of the world's largest fisheries, and changes in weather far away, including in the United States. This page explains the normal Pacific, then its two departures: El Niño and La Niña.
A normal year in the Pacific
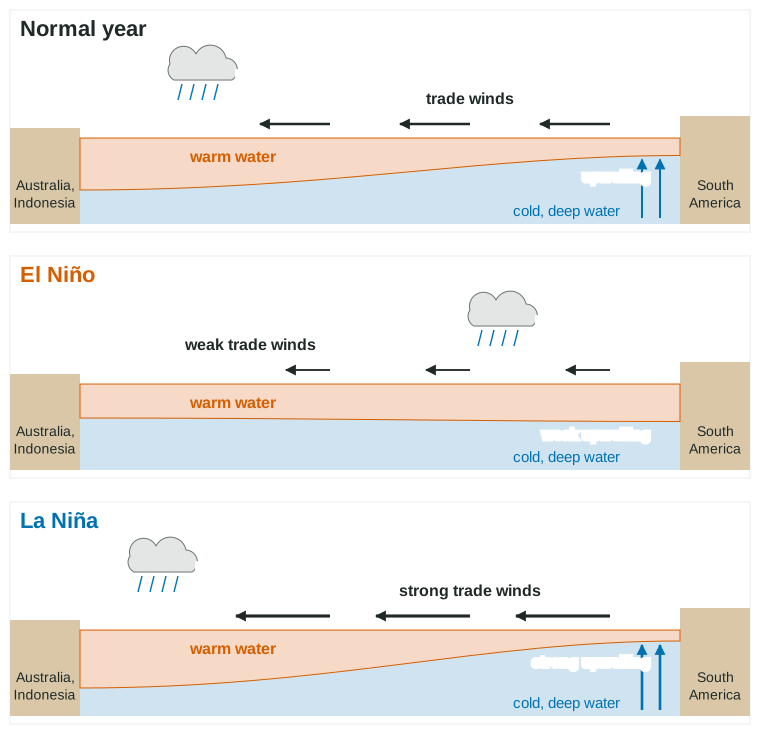
Along the equator, the trade winds blow from east to west across the Pacific. They drag the warm surface water with them, so warm water piles up in the western Pacific, near Indonesia and Australia. There the sea surface is the warmest of any large ocean area, and the warm water heats the air above it, which rises and drops heavy rain.
Off the coast of South America, as the wind pushes surface water away, cold water from deep below rises to replace it. This is upwelling. Deep water is rich in nutrients such as nitrate and phosphate, because dead organisms sink and decompose there. Upwelling brings those nutrients into sunlight, where phytoplankton use them, so the coast of Peru supports enormous schools of anchovies and the seabirds, sea lions and fishing fleets that feed on them.
El Niño: the trade winds weaken
Every 2 to 7 years, the trade winds weaken, and in some places reverse. With less wind holding it back, the warm water in the west sloshes east across the Pacific. The eastern Pacific, off Peru and Ecuador, warms by a few degrees. The layer of warm surface water there gets thicker, so upwelling, which now draws up warm water, brings up far fewer nutrients.
The rising air and heavy rain follow the warm water east. The results:
- Peru and Ecuador: heavy rain and floods on normally dry coasts; fisheries decline as nutrients drop.
- Indonesia and Australia: drought and a higher risk of wildfire.
- The United States: in winter, the southern states tend to be wetter and the northern states milder than normal.
- The Atlantic: fewer hurricanes, because winds high in the atmosphere tear storms apart.
- The world: a little warmer on average that year, as the large warm Pacific surface gives heat to the air.
La Niña: the trade winds strengthen
La Niña is the opposite. The trade winds blow harder than normal, pushing warm water even farther west and pulling up more cold water off South America. The eastern Pacific is cooler than average. Upwelling is strong, so fisheries off Peru do well. Rain is heavier over Indonesia and Australia, while Peru and the southern United States tend to be drier. The Atlantic tends to have more hurricanes.
El Niño vs La Niña
| El Niño | Normal | La Niña | |
|---|---|---|---|
| Trade winds | weak | moderate | strong |
| Eastern Pacific surface water | warmer than average | cool | colder than average |
| Upwelling off Peru | weak | strong | stronger |
| Fishing off Peru | poor | good | good |
| Rain in Peru and Ecuador | heavy, floods | dry | drier |
| Rain in Indonesia and Australia | drought | wet | wetter, floods |
| Southern United States in winter | wetter | (varies) | drier |
| Atlantic hurricanes | fewer | (varies) | more |
A memory hook: El Niño warms the water off Peru. If the eastern Pacific is warm and the trade winds are weak, it is El Niño.
The Southern Oscillation and ENSO
The changes in the ocean come with a seesaw in air pressure across the Pacific, called the Southern Oscillation: when pressure is high over the western Pacific it is low over the eastern Pacific, and the reverse. Scientists combine the two in one name, the El Niño-Southern Oscillation (ENSO). ENSO is a natural cycle with three phases: El Niño, neutral and La Niña. Each El Niño or La Niña usually lasts about 9 to 12 months, and they recur irregularly, every 2 to 7 years. NOAA counts an El Niño when the three-month average sea surface temperature in the central equatorial Pacific (the Niño 3.4 region) is at least 0.5 °C above normal for five overlapping three-month periods in a row, and a La Niña when it is at least 0.5 °C below normal for as long.
Reading ENSO data
ENSO questions usually give a map of sea surface temperatures compared with average, a graph of temperature over time, or data on rainfall or fish catch. Look for warm water in the eastern Pacific (El Niño) or cold water there (La Niña), then follow the chain: winds, upwelling, nutrients, fish; and warm water, rising air, rain.
Worked example. The anchovy catch off Peru was 5.0 million metric tons in a normal year and 1.5 million metric tons during an El Niño. What was the percent change?
Setup: .
Answer: . The catch fell by 70%.
Explain it as a chain: weaker trade winds, weaker upwelling, fewer nutrients, less phytoplankton, fewer anchovies.
Check yourself
- What happens to the trade winds in El Niño? (They weaken.)
- Why do fisheries off Peru suffer in El Niño? (Upwelling weakens, so fewer nutrients reach the surface.)
- Where is it rainy during La Niña? (The western Pacific: Indonesia and Australia.)