Setting Up a Test for the Difference Between Two Population Means
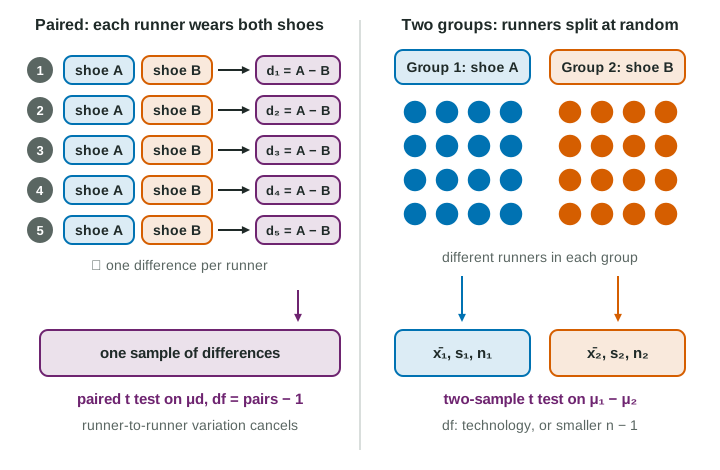
To set up a test for two means, decide from the design whether the data are paired or two independent groups.
Part 1 · Hook
Why this matters
Part 2 · Before you start
What this builds on
Part 3 · Prerequisite check
Quick check before you start
1. Which statement about a 95% interval for from 1.2 to 4.8 is true?
- It gives convincing evidence that
- It proves
- 0 is a plausible value for the difference
- It is about the two sample means
Show the answer
Every plausible value is positive, so is supported.
- Correct: It gives convincing evidence that :
- It proves :
- 0 is a plausible value for the difference:
- It is about the two sample means:
2. Hypotheses for a paired t test are usually
- and an alternative about
- for two independent samples
Show the answer
The parameter is the true mean difference, and the null value is 0.
- Correct: and an alternative about :
- :
- for two independent samples:
- :
Part 4 · See it
See it first
Part 5 · Step by step
How it works, step by step
- Two independent groups (two random samples, or random assignment to two treatments)the parameter is and the test is a two-sample t test
- Write and with , or from the questiondefine and in context, with the order of subtraction
- Check random, 10% (each sample) and normal/large sample (each group)the two-sample t test can be trusted
- Two measurements on each unit, or matched unitsthe data are paired, so use a paired t test on the differences instead; pairing removes unit-to-unit variation
Part 6 · Key ideas
Key ideas
- Two-sample t test: (or ) against , or .
- Define both parameters in context: " = the true mean battery life of all new brand X phones".
- Conditions for each group: random (independent random samples or random assignment), 10% (when sampling), normal/large sample.
- Paired or two-sample is decided by the design: same units twice or matched units, paired; separate groups, two-sample.
Part 7 · Misconception
A common mistake
The wrong idea: Any study with two columns of numbers uses a two-sample t test.
What actually happens: If the two columns are linked unit by unit (before and after, twins, both shoes on the same runner), the data are paired: test the mean of the differences. A two-sample t test is for two independent groups.
Part 8 · Check yourself
Check yourself
Exam-style questions. Anything you miss goes into your review queue.
Graph
Battery life of two phone brands
A consumer group bought a random sample of 15 new phones of brand X and an independent random sample of 15 of brand Y, from the hundreds of thousands sold, and ran each until its battery died while streaming video (invented data). The group asks whether brand X phones last longer on average. Brand X: mean 9.80 hours, SD 1.10; brand Y: mean 9.10 hours, SD 1.30.
1. Which hypotheses match the consumer group's question?
- ,
- ,
, - ,
Show the answer
, (equivalently and ).
- , : The question has a direction ("longer"), set before the data, so the alternative is one-sided.
- Correct: , : The null says no difference in true mean battery life; the alternative says brand X lasts longer on average.
, : Hypotheses use parameters, never sample means. - , : There are no pairs here: the phones of the two brands are separate samples.
2. How should be defined?
- The true mean battery life while streaming of all new brand X phones
- The mean battery life of the 15 brand X phones tested
- The difference in mean battery life between brand X phones and brand Y phones
- The battery life of a typical brand X phone
Show the answer
= the true mean battery life (hours, while streaming video) of all new brand X phones; likewise for brand Y.
- Correct: The true mean battery life while streaming of all new brand X phones: A parameter is a population value, named in context.
- The mean battery life of the 15 brand X phones tested: That is the sample mean, 9.80 hours.
- The difference in mean battery life between brand X phones and brand Y phones: That is ; is one brand's mean.
- The battery life of a typical brand X phone: The parameter is a mean, not one phone's value.
3. Which test fits this study?
- A paired t test on the 15 differences, brand X minus brand Y
- A one-sample t test of
- A two-proportion z test
- A two-sample t test for
Show the answer
Two independent groups and a mean response: a two-sample t test.
- A paired t test on the 15 differences, brand X minus brand Y: Phone 1 of brand X has no partner among the brand Y phones, so there is nothing to pair.
- A one-sample t test of : 9.10 is a sample mean with its own variability, not a known value to test against.
- A two-proportion z test: Battery life is quantitative, so compare means.
- Correct: A two-sample t test for : Two independent random samples, a quantitative response and unknown population standard deviations.
4. Each brand has only 15 phones. How is the normal/large sample condition checked?
- Each boxplot shows no strong skew and no outliers
- The two samples together have 30 phones
- Battery lives are normally distributed
- The two sample standard deviations are about equal
Show the answer
Normal/large sample, for each group: normal population, , or a graph without strong skew or outliers. Here, the graphs.
- Correct: Each boxplot shows no strong skew and no outliers: Both samples are smaller than 30, so each group's graph must look roughly symmetric without outliers, as these do.
- The two samples together have 30 phones: Each sample is checked separately; 15 is less than 30.
- Battery lives are normally distributed: Nothing says the populations are normal, so the graphs are the evidence.
- The two sample standard deviations are about equal: Equal spreads are not a condition for this test.
5. How is the 10% condition met?
- 30 phones in total is less than 10% of both brands combined
- The phones were randomly selected
- 15 is less than 10% of the phones sold, for each brand
- It is not needed, because this is an experiment
Show the answer
Sampling without replacement from each brand: for each brand.
- 30 phones in total is less than 10% of both brands combined: Check each sample against its own population.
- The phones were randomly selected: That is the random condition.
- Correct: 15 is less than 10% of the phones sold, for each brand: Each sample is a tiny share of its own brand's hundreds of thousands of phones.
- It is not needed, because this is an experiment: The phones were sampled, not assigned to treatments, so the 10% condition applies.
6. Which studies call for a two-sample t test? Select all that apply.
- Commute times of a random sample of nurses and an independent random sample of teachers
- Plant growth for seeds randomly assigned to two fertilizers
- Reaction time of 25 drivers, each tested with and without a phone call
- The proportion of voters in two towns who support a park
- Weights of 30 patients before and after a diet
Show the answer
Two-sample t: two independent groups and a quantitative response. Two measurements on the same units: paired t.
- Correct: Commute times of a random sample of nurses and an independent random sample of teachers: Right: two independent random samples, a mean response.
- Correct: Plant growth for seeds randomly assigned to two fertilizers: Right: two groups formed by random assignment.
- Reaction time of 25 drivers, each tested with and without a phone call: Each driver is tested twice: paired.
- The proportion of voters in two towns who support a park: That compares proportions, not means.
- Weights of 30 patients before and after a diet: Before and after on the same patients: paired.
Part 9 · Summary
Summary
Part 10 · Up next
What comes next
Part 11 · Connections