Look at a map of any country and you will see a few big cities and many small towns. Four models from this topic describe how many cities of each size a country has, how they interact and why they are spaced the way they are.
The rank-size rule
Rank the cities of a country from largest (rank 1) to smaller ones (rank 2, 3, and so on). The rank-size rule says the city of rank n has about 1/n the population of the largest city:
Worked example. In an invented country, the largest city has 12 million people. The rule expects the 2nd city to have million, the 3rd million and the 4th million. Divide by the rank; do not multiply.
A country whose cities fit the rule has a smooth ladder of city sizes, with no one city in charge of everything. The United States has often been described as a rough fit at the national scale. The rule is a pattern seen in data, not a law; it says nothing about why cities grow.
The primate city
A primate city is a country's largest city when it is far larger than the second city, often more than twice its size, and leads the country in government, business and culture. The geographer Mark Jefferson named the idea in 1939. Bangkok in Thailand, Lima in Peru and Paris in France are often given as examples at the national scale.
Primate cities often come from history. A colonial power usually ran a colony from one port, where it built the government offices, the railroad terminus and the trading houses; after independence, that city stayed the capital and kept drawing migrants and money. A primate city brings benefits (one strong center for business and transport) and problems (crowding, high costs, and other regions left behind).
The gravity model
The gravity model predicts how much two places interact: trips, phone calls, trade or migration. Interaction grows with the populations of the two places and falls with the square of the distance between them:
Worked example. Town 1 has 200 thousand people and Town 2 has 50 thousand; they are 10 units apart. Interaction
Planners use the model to guess where shoppers will go or how much traffic a new road will carry. Its limits: a national border, a language difference or a mountain range can cut interaction more than distance alone predicts, and the internet lets some places interact a lot across great distances.
Central place theory
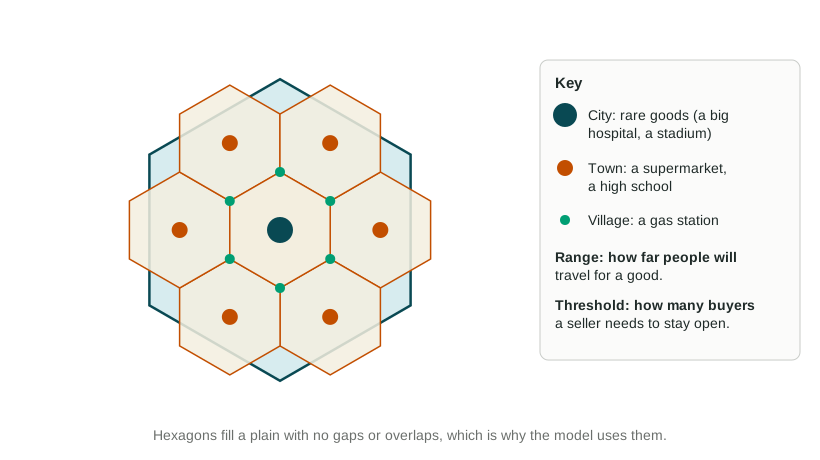
In 1933, Walter Christaller studied towns in southern Germany. His central place theory treats every settlement as a central place, a market center that sells goods and services to the area around it. Two ideas drive the model:
- Threshold: the fewest customers a seller needs to stay in business. A heart surgery center needs hundreds of thousands of people; a gas station needs a few hundred.
- Range: the greatest distance people will travel to buy a good. People drive hours for a heart specialist but only a few minutes for gas.
Goods with a high threshold and long range are high-order goods, found only in a few large central places spaced far apart. Low-order goods are sold in many small places close together. Christaller drew each market area as a hexagon, because hexagons cover a plain with no gaps and no overlaps, unlike circles.
The model assumes a flat, even plain, people spread evenly, travel equally easy in every direction and shoppers who go to the nearest place. Real regions have rivers, mountains and highways; people combine errands into one trip; and online shopping lets a small town reach goods with a huge range. The pattern fits flat farm regions, such as parts of the US Midwest, better than mountain or coastal ones.
The four models side by side
| Model | What it predicts | One limit |
|---|---|---|
| Rank-size rule | The nth city has 1/n the population of the largest | Fails where a primate city dominates |
| Primate city | One city far larger than the rest leads the country | Describes a pattern; does not say it will last |
| Gravity model | Big, close places interact most | Borders, culture and the internet bend distance |
| Central place theory | A few large, widely spaced places; many small, close ones | Assumes a flat plain and nearest-place shopping |