A map is a drawing of part or all of the Earth that shows where things are or how something changes from place to place. No map shows everything. Each one is made for a job, and the map maker chooses what to put in, what to leave out and how to draw it.
Reference maps and thematic maps
A reference map shows where things are: borders, cities, rivers, roads and names. A road atlas or the political map on a classroom wall is a reference map. A thematic map shows one topic or measure across places, such as income, rainfall or the number of people, with a legend that explains the shades or symbols. A map of Southeast Asia that only names Myanmar, Thailand, Viet Nam and Indonesia is a reference map. The same outline shaded by each country's World Bank income group (FY27) is a thematic map.
Kinds of thematic map
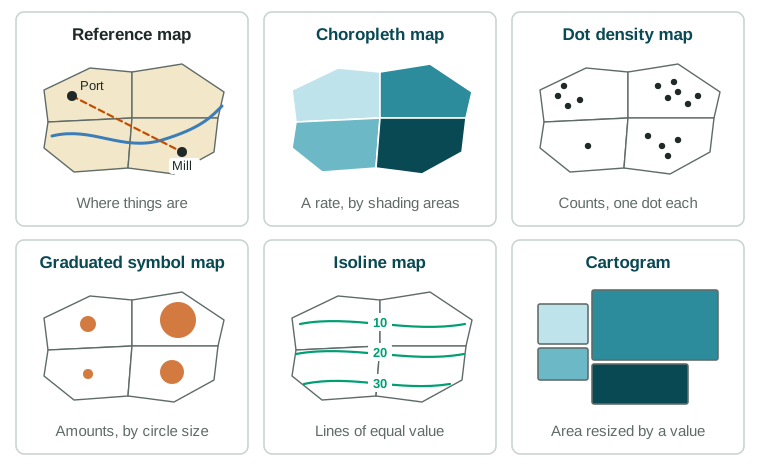
| Map type | How it shows data | Best for | Watch out for |
|---|---|---|---|
| Choropleth | Shades whole areas by class | Rates and percents by country or province | Totals favor big areas; one shade hides differences inside an area |
| Dot density | One dot stands for a set count | Where people or things are, such as farms | Dots can pile up and hide each other |
| Graduated symbol | Circles sized by amount | Amounts at points, such as the size of cities | Big circles can cover small ones |
| Isoline | Lines join points of equal value | Values that change smoothly: height, temperature | You must read the line values |
| Cartogram | Resizes areas by a value | Comparing countries by people or wealth | Shapes and true sizes are given up |
On an isoline map of height, the spacing of the lines tells you the slope: lines packed together mean steep land, and lines far apart mean gentle land. A population cartogram shows India and China very large, because each has over a billion people (UN World Population Prospects 2024), while Canada and Russia, with huge land areas but far fewer people, shrink.
Projections: every flat map distorts
The Earth is round, and a map is flat. A map projection is the method for flattening the globe, and it always causes distortion: a change in shape, area, distance or direction. Try flattening an orange peel: it tears or stretches. A projection can keep one or two properties true, but never all four. That is the trade-off.
- A projection that keeps shapes and compass angles true is useful for navigation, but it makes land near the poles look far too big. On such a map, Greenland looks about as large as Africa, though Africa has about 14 times more land.
- A projection that keeps areas true is fair for comparing the sizes of countries, but shapes are stretched or squashed.
- Some projections keep distances or directions true from one center point, which suits airline routes from one city.
Distance, direction and arrangement
Absolute distance is measured in kilometers or miles. Relative distance is how far a place feels in time, cost or ease: two towns 100 km from a city can be one hour or three hours away, depending on the road. Absolute direction uses the compass: Indonesia lies south of Viet Nam. Relative direction depends on where you stand: Europeans long called Southwest Asia "the Middle East", though from India it lies to the west.
Maps also show how things are arranged. Clustering means features are grouped close together, like houses around the square of a Dutch village. Dispersal means they are spread out, like farmhouses across the Iowa plains. Maps can also show elevation, the height of the land above sea level, with lines of equal height or with colors.