To understand how a neighborhood is changing, you need two kinds of evidence: counts that show what changed, and voices that show what it means. This topic is about where each comes from and what each can and cannot tell you.
Quantitative data: censuses and surveys
Quantitative data are numbers. For cities, the most important source is the census, an official count of every person and household. The United States counts everyone every 10 years; the most recent count was in 2020. The census reports results for small areas called census tracts, each usually holding a few thousand people, so researchers can compare neighborhoods within a city.
Survey data come from asking a sample of people the same set of questions. The US Census Bureau's American Community Survey (ACS) asks a sample of households every year about income, rent, education, language and how they travel to work. Because it asks a sample, not everyone, its figures are estimates, published with a margin of error. For a small area, that margin can be large, so a small change from one year to the next may not be real.
Census and survey data show patterns and trends: where the population is growing, which tracts have the highest rents, how the share of renters changed. They let you compare places at the same scale and track one place over time.
Qualitative data: field studies and narratives
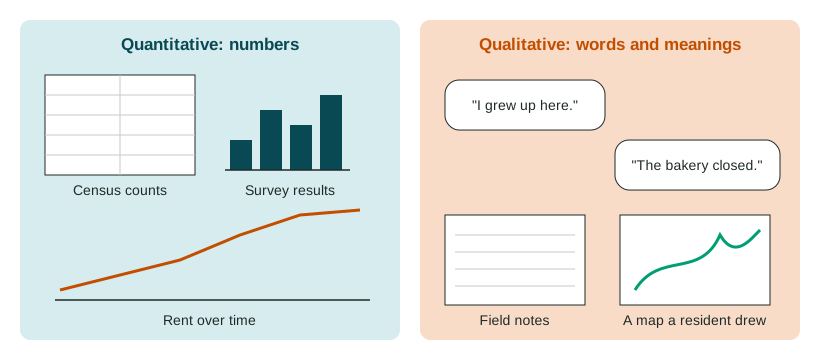
Qualitative data are words, images and observations. Urban geographers collect them by:
- Interviews with residents, shop owners, officials and newcomers;
- Field observation: walking a neighborhood and recording what is there, such as which stores are open, who uses the park, how the buildings look;
- Narratives: residents' life stories, oral histories and local writing;
- Photos and mental maps: residents draw the places that matter to them.
Qualitative data reveal attitudes and reasons. They can show that long-time residents feel a loss of community, that new arrivals feel welcome or unwelcome, or that a family moved because its landlord sold the building, details no census table holds.
What each can and cannot show
| Census and survey data | Interviews and field studies | |
|---|---|---|
| Answers | How many? How much? Where? How fast? | Why? How do people feel? What does it mean? |
| Strength | Covers many people; can be compared across places and years | Rich detail; reveals causes and meanings |
| Limit | Misses reasons and feelings; sample estimates have error | Few people; may not represent the whole neighborhood; the researcher's choices shape it |
Scale and data
Data are collected for one scale and can mislead at another. Citywide figures are aggregated data: they combine many neighborhoods into one number. A city's average rent may rise only a little while rents in one tract double. The reverse also holds: what ten residents of one block say does not tell you how the whole city feels. Always name the scale of the data and do not stretch a conclusion past it.
Putting them together
A good study of urban change mixes methods. Suppose census tables for a tract in Washington, D.C., show that median rent and household income rose fast between 2010 and 2020 while the number of long-time renters fell. Interviews could then ask the renters who stayed, and some who left, what drove the change and how they see it. The numbers show the size of the change; the voices explain it. City councils use both when they decide where to build housing, protect renters or invest in services.