A regression line gives a prediction for every value of , but real points do not sit on the line. How far each one misses, and whether the misses follow a pattern, tells you how good the line is and whether a line was the right shape at all.
What a residual is
For each data point, the residual is the actual value minus the predicted value:
On a scatterplot it is the vertical gap between the point and the line. A residual has the units of .
- A positive residual: the point is above the line, so the line underpredicted.
- A negative residual: the point is below the line, so the line overpredicted.
- A residual of 0: the point is on the line.
Worked example 1. A cafe's line for predicting iced drinks sold from the day's high temperature is . On an 80°F day it sold 160 drinks. Find and interpret the residual.
Predicted:
Residual: drinks.
Interpretation: on that 80°F day, the cafe sold about 2.25 more iced drinks than the line predicts.
Order matters. Predicted minus actual has the opposite sign and the opposite meaning. Always subtract the prediction from the actual value.
The residual plot
A residual plot graphs each residual against its value (some software uses instead; the reading is the same). It takes the trend out of the picture. Whatever is left is what the line failed to capture. A horizontal line at 0 marks "exactly predicted".
Read a residual plot like this:
| Residual plot | What it means |
|---|---|
| random scatter above and below 0, even spread | a line is a reasonable model |
| a curve (U shape or upside-down U) | the relationship is curved; a line is not appropriate |
| a fan (spread grows or shrinks with ) | predictions are less precise where the spread is larger |
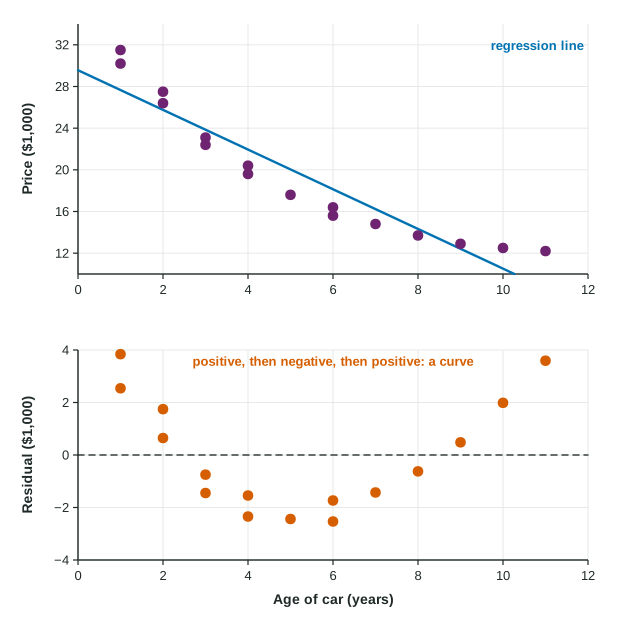
Worked example 2. The figure shows 16 used cars, age against price, with a regression line, and the residual plot below it. Is a line appropriate?
The residuals are positive for the newest cars (about 2.5 to 3.8 thousand dollars at 1 year), negative for cars aged 3 to 8, and positive again for the oldest (about 3.6 thousand at 11 years). That U shape is a clear pattern: price drops quickly at first and then levels off, and a line cannot bend to follow it. A line is not an appropriate model.
The pattern also says where the line's predictions go wrong: it underpredicts the newest and oldest cars and overpredicts the middle-aged ones.
Why both signs are not enough
Any line fit through the middle of a cloud of points has some points above and some below, so "the residuals are positive and negative" says nothing. Small residuals are not enough either. The question is whether they form a pattern. Even a correlation near 1 can hide a curve: the car data have about , a strong linear association by the number, yet the residual plot shows the line is the wrong shape.
Putting it together
A full regression check goes in this order: plot the data and describe it; fit a line; look at the residual plot; then, only if the residuals show no pattern, use the line to predict and interpret its slope. Topic 5.5 adds the last pieces: how the line is chosen and how to measure its typical error.