Residuals
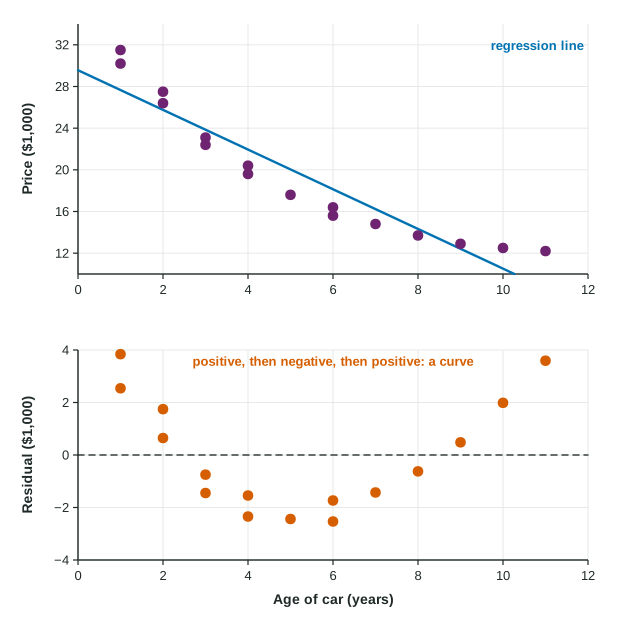
A residual is actual minus predicted, y − y-hat : positive when the point is above the line, negative when below, in the units of y .
Part 1 · Hook
Why this matters
Part 2 · Before you start
What this builds on
Part 3 · Prerequisite check
Quick check before you start
1. For , what is the predicted value at ?
Show the answer
.
- Correct: :
- :
- :
- :
2. What does the hat in mean?
- A predicted value
- An observed value
- An average of the values
- A residual
Show the answer
is a predicted value from the line.
- Correct: A predicted value:
- An observed value:
- An average of the values:
- A residual:
Part 4 · See it
See it first
Part 5 · Step by step
How it works, step by step
- A line predicts for each observed each point misses by its residual, , the vertical gap from the line
- A point above the linehas a positive residual: the line underpredicts; below the line, negative: it overpredicts
- Plot each residual against the residual plot removes the trend, so what is left is the pattern the line missed
- Random scatter around 0 means the line is fine; a curve means the data bend; a fan means the spread changesuse the residual plot to decide whether a linear model is appropriate
Part 6 · Key ideas
Key ideas
- Residual , actual minus predicted, in the units of .
- Positive residual: actual above the line (underpredicted). Negative: below the line (overpredicted).
- A residual plot graphs residuals against (or against ).
- No pattern: a line is appropriate. A curved pattern: a line is not. A fan: predictions are less precise where the spread is larger.
Part 7 · Misconception
A common mistake
The wrong idea: If the residuals are both positive and negative, the line must fit well.
What actually happens: Every line has residuals of both signs. What matters is the pattern: a curve or fan in the residual plot means the line misses the data in a systematic way.
Part 8 · Check yourself
Check yourself
Exam-style questions. Anything you miss goes into your review queue.
Graph
Car age and price: the line and its residuals
1. The 5-year-old car is listed at 17.6 thousand dollars. What is its residual, in thousands of dollars? Give two decimal places.
Type a number. A table answer and a calculator answer are both accepted.
Show the answer
- Answer: -2.44
2. Interpret the residual of about for the 5-year-old car.
- It sold for about 2,438 dollars below the line's prediction
- Its price is about 2,438 dollars more than the line predicts
- The car lost about 2,438 dollars of value each year
- The line is wrong for this car and should be refit without it
Show the answer
Residual ; negative means the line overpredicts.
- Correct: It sold for about 2,438 dollars below the line's prediction: Right: a negative residual means the actual value is below the predicted value.
- Its price is about 2,438 dollars more than the line predicts: Negative means below the line: actual minus predicted is less than 0.
- The car lost about 2,438 dollars of value each year: A residual is a gap between actual and predicted, not a yearly change.
- The line is wrong for this car and should be refit without it: Every point has a residual; a moderate one is normal scatter.
3. What does the residual plot show about using a line for these data?
- A line is appropriate, because the residuals are both positive and negative
- A line is appropriate, because the residuals are small
- A line is not appropriate, because some residuals are negative
- A line is not appropriate: the residuals form a U-shaped curve
Show the answer
A good line leaves residuals scattered randomly around 0, with no pattern.
- A line is appropriate, because the residuals are both positive and negative: Residuals of any line have both signs. What matters is whether they form a pattern.
- A line is appropriate, because the residuals are small: Size alone does not settle it; the curved pattern shows a line is the wrong shape.
- A line is not appropriate, because some residuals are negative: Negative residuals are expected. The problem is the curved pattern.
- Correct: A line is not appropriate: the residuals form a U-shaped curve: Right: a pattern in the residuals means the relationship is curved, so a line misses it in a systematic way.
4. For which cars does the line underpredict the price?
- The newest cars, but not the oldest
- No cars, since the line is fit to the data
- The newest and the oldest cars
- The cars aged 4 to 7 years
Show the answer
Underpredict: positive residual, actual above predicted.
- The newest cars, but not the oldest: The oldest cars also have positive residuals.
- No cars, since the line is fit to the data: A fitted line still misses individual points both ways.
- Correct: The newest and the oldest cars: Right: their residuals are positive, so the actual prices are above the line.
- The cars aged 4 to 7 years: Those residuals are negative: the line overpredicts them.
5. A line predicts a student's exam score from homework average: . A student with a homework average of 40 scored 47. Write the expression for the residual, then evaluate it.
Type the expression as on the exam, with the values substituted.
Show the answer
Residual
- Answer:
6. A line overpredicts a value. What is the sign of its residual?
- Positive
- Zero
- It depends on the slope
- Negative
Show the answer
Below the line: negative residual.
- Positive: Positive means the actual value is above the prediction, an underprediction.
- Zero: Zero means the prediction is exact.
- It depends on the slope: The sign depends only on whether the point is above or below the line.
- Correct: Negative: Right: overpredicting means , so .
Part 9 · Summary
Summary
Part 10 · Up next
What comes next
Part 11 · Connections