A scatterplot describes a relationship; a correlation measures how linear it is. The next step is to use the relationship: to predict the response for a given value of the explanatory variable. When the pattern is linear, a straight line does that.
The regression line
A regression line is a line that describes how the response changes, on average, as the explanatory variable changes. In statistics it is written
where is the intercept and is the slope, the same kind of equation as from algebra. Watch the letters: here is the slope (algebra's ) and is the intercept (algebra's ), written first. The hat on ("y-hat") says that the output is a predicted value, not an observed one. Real data points scatter above and below the line; the line gives the typical value for each . (This equation, , is on the reference sheet.)
Where does the line come from? Usually from technology, which fits the line to the data. Topic 5.5 explains how the best line is chosen. For now, take the equation as given and learn to use it.
Making a prediction
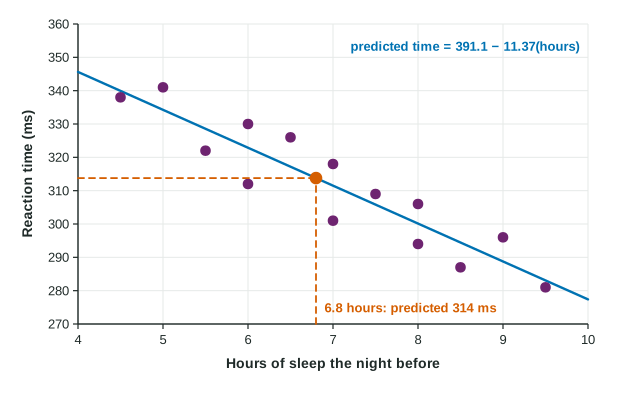
Worked example 1. For 14 students, the line for predicting reaction time (milliseconds) from hours of sleep is . Predict the reaction time of a student who slept 6.8 hours.
In words: the line predicts a reaction time of about 314 milliseconds for a student who slept 6.8 hours. The figure shows the same prediction: up from 6.8 to the line, then across.
Interpreting the slope
The slope is the change in the predicted value for each one-unit increase in . Its units are units of per unit of . Use this template, filling in context:
"For each additional [unit of ], the predicted [] increases (decreases) by about [units of ]."
For the sleep line: for each additional hour of sleep, the predicted reaction time decreases by about 11.4 milliseconds. The word "predicted" matters. The slope does not say that every student who sleeps one more hour reacts exactly 11.4 milliseconds faster; it describes the trend of the predictions.
The slope always has the same sign as the correlation: a negative association gives a falling line.
Interpreting the intercept, when it makes sense
The intercept is the predicted when . Interpret it only if is a sensible value inside, or very near, the data.
Worked example 2. A resale site fits
Slope: for each additional year of age, the predicted resale price decreases by about 95 dollars.
Intercept: a new phone (age 0) has a predicted price of 620 dollars. This makes sense, because new phones are in the data.
A prediction: for a 3.5-year-old phone, , so about 287.50 dollars.
Compare a line for children aged 5 to 12, for height in centimeters. The intercept would describe a newborn, but no newborns are in the data, and children do not grow at a steady rate from birth. So the intercept has no useful meaning here.
Extrapolation
A line is fit to the values in the data. Using it far outside that range is extrapolation, and it is unreliable: nothing in the data says the pattern continues. The phone line predicts dollars for an 8-year-old phone, an impossible price. The sleep line predicts about 243 milliseconds for 13 hours of sleep, far faster than any student in the data, who all slept 4.5 to 9.5 hours. Both numbers come out of the equation; neither should be trusted.
| Part | Meaning | Template |
|---|---|---|
| predicted value of | "The predicted [] for [ value] is ..." | |
| predicted change in per unit of | "For each additional ..., the predicted ... increases (decreases) by about ..." | |
| predicted when | "When [] is 0, the predicted [] is ...", only if makes sense |