Linear Regression Models
A regression line y-hat = a + bx predicts the response from the explanatory variable.
Part 1 · Hook
Why this matters
Part 2 · Before you start
What this builds on
Part 3 · Prerequisite check
Quick check before you start
1. What is the slope of ?
Show the answer
In , the slope is the coefficient of .
- Correct: :
- :
- :
- :
2. For , what is when ?
Show the answer
.
- Correct: :
- :
- :
- :
3. Which variable goes on the horizontal axis of a scatterplot?
- The explanatory variable
- The response variable
- The larger variable
- Either, always
Show the answer
Explanatory on , response on .
- Correct: The explanatory variable:
- The response variable:
- The larger variable:
- Either, always:
Part 4 · See it
See it first
Part 5 · Step by step
How it works, step by step
- A scatterplot shows a linear patterna line can summarize it and predict from
- Substitute a value of the result is a predicted value: typical for that , not exact for any one individual
- The slope is the change in per one-unit increase in interpret it as "for each additional ..., the predicted ... increases (decreases) by about ..."
- The line was fit only to the values in the datapredicting far outside that range (extrapolation) can give nonsense, and the intercept means something only when is reasonable
Part 6 · Key ideas
Key ideas
- A regression line gives predicted values of the response for values of the explanatory variable.
- Slope: "For each additional [unit of ], the predicted [] increases (decreases) by about [units of ]."
- Intercept: "When [] is 0, the predicted [] is ." Interpret it only when makes sense.
- Extrapolation, predicting outside the range of the data, is unreliable.
Part 7 · Misconception
A common mistake
The wrong idea: The slope says exactly how much each individual's changes when goes up by 1.
What actually happens: The slope describes the predicted value, the average trend. Individuals scatter around the line, so always say "the predicted ..." when you interpret it.
Part 8 · Check yourself
Check yourself
Exam-style questions. Anything you miss goes into your review queue.
Graph
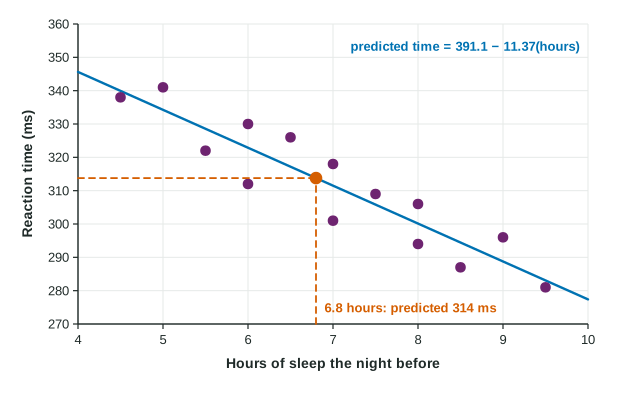
Sleep and reaction time, with a regression line
1. What reaction time does the line predict for a student who slept 6.8 hours?
- About 77 milliseconds
- About 468 milliseconds
- About 314 milliseconds
- About 391 milliseconds
Show the answer
Substitute into the equation.
- About 77 milliseconds: That is only the slope times 6.8. Add it to the intercept with its sign: .
- About 468 milliseconds: That adds the slope term. The slope is negative, so subtract.
- Correct: About 314 milliseconds: Right:
. - About 391 milliseconds: That is the intercept, the prediction for 0 hours of sleep.
2. Which is the correct interpretation of the slope?
- For each extra hour of sleep, predicted reaction time drops by about 11.4 ms
- A student who slept 0 hours is predicted to react in 391 milliseconds
- For each millisecond of reaction time, predicted sleep decreases by 11.4 hours
- For each additional hour of sleep, reaction time decreases by exactly 11.4 milliseconds
Show the answer
Slope: "for each additional [unit of ], the predicted [] increases (decreases) by about [units of ]".
- Correct: For each extra hour of sleep, predicted reaction time drops by about 11.4 ms: Right: the slope is the predicted change in for each one-unit increase in , in context.
- A student who slept 0 hours is predicted to react in 391 milliseconds: That describes the intercept, and 0 hours is far outside the data.
- For each millisecond of reaction time, predicted sleep decreases by 11.4 hours: The line predicts reaction time from sleep, not the other way round.
- For each additional hour of sleep, reaction time decreases by exactly 11.4 milliseconds: The line gives predictions, not exact changes for each student. Say "predicted".
3. The line predicts a reaction time of about 243 milliseconds for a student who sleeps 13 hours. How much should this prediction be trusted?
- Hardly, because predictions do not work for one person
- Very little: 13 hours is far outside the data, so it is extrapolation
- Fully, because the equation gives a number
- Fully, because the association between sleep and reaction time is strong
Show the answer
Extrapolation: predicting outside the range of values in the data.
- Hardly, because predictions do not work for one person: Predictions inside the data range are reasonable for typical students. The problem is extrapolating.
- Correct: Very little: 13 hours is far outside the data, so it is extrapolation: Right: no one in the data slept that long, so there is no reason to think the linear trend continues there.
- Fully, because the equation gives a number: Any gives a number; that does not make the prediction sensible.
- Fully, because the association between sleep and reaction time is strong: A strong association inside the data says nothing about values far outside it.
Table
Used phone prices
| Term | Value | Meaning |
|---|---|---|
| Intercept | 620 | predicted price at age 0 |
| Slope | change in predicted price per year of age |
4. Interpret the slope in context.
Write the conclusion in context.
Show the answer
Slope: predicted change in per one-unit increase in .
- A full-credit answer: For each additional year of age, the predicted resale price of this phone model decreases by about 95 dollars.
5. Write the expression for the predicted price of a 3.5-year-old phone, then evaluate it.
Type the expression as on the exam, with the values substituted.
Show the answer
- Answer:
6. A regression line has slope 2.5 and passes through the point . What is its equation?
Show the answer
Substitute the point into and solve for .
- : Subtract 10 from 30, do not add it.
- : That uses the value as the intercept. Solve .
- : That uses the value as the intercept.
- Correct: : Right: , so .
Part 9 · Summary
Summary
Part 10 · Up next
What comes next
Part 11 · Connections