Unit 5 describes how one quantitative variable changes with another using a straight line. Before that, you need to be comfortable reading any line: what its slope says, what its intercept says, and how to find both.
The equation of a line
Statistics writes a line as
with the intercept first. is the slope and is the y-intercept. (Algebra classes often write ; it is the same line with different letters.)
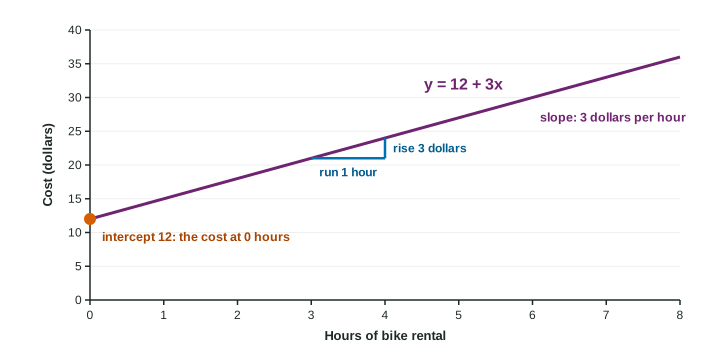
Slope
The slope is the change in y for each one-unit increase in x. On a graph it is rise over run: from any point on the line, move 1 unit right, and y changes by . A positive slope rises; a negative slope falls.
From two points and :
Subtract in the same order on top and bottom. The slope has units: y units per x unit, such as dollars per hour.
Slope and intercept from two points. A line passes through and .
Slope:
Intercept: write and use one point, : , so .
Equation: . Check with the other point: . Correct.
Intercept
The y-intercept is the value of y when , where the line crosses the vertical axis. For the bike rental , it is the 12 dollar fee charged before any hours. Sometimes makes no sense: a line giving adult height from shoe length has an intercept at shoe length 0, which no adult has. Then the intercept is just a number that places the line, with no meaning of its own.
Saying it in context
Interpret a line. A cooling drink’s temperature is degrees Fahrenheit after minutes.
Slope: "For each additional minute, the temperature of the drink decreases by 2.5 degrees."
Intercept: "At 0 minutes, when it is poured, the drink is 80 degrees." Here makes sense, so the intercept has a meaning.
A value: after 6 minutes,
| Slope | Intercept | |
|---|---|---|
| Meaning | change in y per one-unit increase in x | y when |
| Units | y units per x unit | y units |
| Template | "For each additional [x unit], [y] increases (decreases) by [b] [y units]." | "When [x] is 0, [y] is [a] [y units]." (only if makes sense) |