Setting Up a Test for a Population Mean or Population Mean Difference
To set up a t test for a mean, name the parameter in context, write H_0:μ = μ_0 and an alternative whose direction comes from the question, and check random, 10% and normal/large sample.
Part 1 · Hook
Why this matters
Part 2 · Before you start
What this builds on
Part 3 · Prerequisite check
Quick check before you start
1. Which pair of hypotheses is written correctly?
- ,
- ,
- ,
- , , using the sample result
Show the answer
Hypotheses are about the parameter, the null holds the equals sign, and the null value comes from the question.
- Correct: , :
- , :
- , :
- , , using the sample result:
2. For paired data, a confidence interval for the mean difference is built from
- the differences within each pair, as one sample
- the two groups as separate samples
- the larger of the two means
- the before values only
Show the answer
Subtract within each pair, then use a one-sample t procedure on the differences.
- Correct: the differences within each pair, as one sample:
- the two groups as separate samples:
- the larger of the two means:
- the before values only:
Part 4 · See it
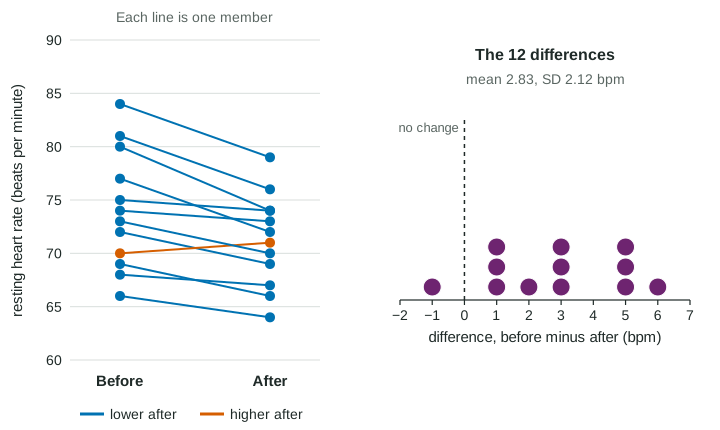
See it first
Part 5 · Step by step
How it works, step by step
- Start from the question, before the datait gives the parameter, the hypothesized mean and the direction of
- Write and with , or define in context: "the true mean ... of all ..."
- If each individual gives two linked measurementsthe data are paired: test on the differences, with the order of subtraction stated
- Check random, 10% and normal/large sample in wordsa one-sample (or paired) t test can be trusted, with
Part 6 · Key ideas
Key ideas
- One-sample t test: against , or .
- Paired t test: a one-sample t test on the differences, . The order of subtraction sets the direction of .
- Hypotheses use parameters (, ), never statistics (), and the direction comes from the question, never from the sample result.
- Conditions: random; 10% when sampling without replacement; normal population, , or a graph of the sample (or the differences) without strong skew or outliers.
Part 7 · Misconception
A common mistake
The wrong idea: The sample mean was below 30, so the alternative should be .
What actually happens: The alternative comes from the research question asked before the data. If the question is "different from 30", the alternative is whatever the sample shows.
Part 8 · Check yourself
Check yourself
Exam-style questions. Anything you miss goes into your review queue.
Table
Delivery times
A delivery company advertises a mean delivery time of 30 minutes in one city. A manager suspects the true mean is longer. She takes a random sample of 45 of last month's thousands of deliveries in the city and records each delivery time (invented data).
| Claim | Suspicion | Sample | Variable |
|---|---|---|---|
| mean delivery time is 30 minutes | the mean is greater than 30 | 45 deliveries, chosen at random | delivery time in minutes |
1. Which hypotheses should the manager test?
- ,
- ,
- ,
- ,
Show the answer
and , where is the true mean delivery time of all the company's deliveries in the city. The hypothesized mean is .
- , : The manager suspects longer times before seeing the data, so the alternative is one-sided: greater than 30.
- Correct: , : The null is the advertised value; the alternative is the manager's suspicion, longer deliveries.
- , : The null hypothesis holds the equals sign and the claim being tested; the suspicion belongs in .
- , : Hypotheses are about the population mean , never the sample mean .
2. Why is a one-sided alternative appropriate here?
- The sample mean will turn out to be greater than 30
- One-sided tests are easier to reject with
- The manager suspected longer delivery times before collecting data
- The sample size is larger than 30
Show the answer
A one-sided is set by a directional question stated in advance ("is the mean longer than advertised?").
- The sample mean will turn out to be greater than 30: Choosing the direction from the sample result is a common error; the question decides it.
- One-sided tests are easier to reject with: Ease of rejecting is not a reason; the research question is.
- Correct: The manager suspected longer delivery times before collecting data: The direction of comes from the question asked before the data, not from the sample result.
- The sample size is larger than 30: Sample size affects the conditions, not the direction of the alternative.
3. The manager has not graphed the delivery times. Is the normal/large sample condition met?
- Yes, because
- No, because delivery times are probably skewed
- Yes, because 45 is less than 10% of last month's deliveries
- No, because a graph of the sample is required for each test
Show the answer
Normal/large sample: . (Still, a quick graph is good practice, to catch extreme outliers.)
- Correct: Yes, because : With a sample of at least 30, the central limit theorem makes the sampling distribution of approximately normal.
- No, because delivery times are probably skewed: Some skew is fine with ; only very strong skew or extreme outliers would worry us.
- Yes, because 45 is less than 10% of last month's deliveries: That is the 10% condition, which is about independence.
- No, because a graph of the sample is required for each test: A graph of the sample is required only when and the population is not known to be normal.
4. A student writes "" for this study. What is wrong?
- It should use 45 instead of 30
- Nothing, and mean the same thing
- It should be a two-sided statement
- It is about the sample mean, which is known once the data are in
Show the answer
Use (the parameter) in hypotheses, never .
- It should use 45 instead of 30: 45 is the sample size, not the hypothesized mean.
- Nothing, and mean the same thing: is a statistic from one sample; is the population parameter.
- It should be a two-sided statement: The null hypothesis is an equality; the problem is the symbol, not the sides.
- Correct: It is about the sample mean, which is known once the data are in: Hypotheses describe the population. Write , with defined in context.
5. A sleep researcher wants to know whether college students at a large university sleep a mean amount different from 8 hours a night. Which hypotheses fit?
- ,
- ,
- ,
- ,
Show the answer
, , where is the true mean nightly sleep of students at the university.
- Correct: , : "Different from" points to a two-sided alternative, with 8 hours as the hypothesized mean.
- , : The question asks about any difference, not only less sleep.
- , : The equality belongs in the null hypothesis.
- , : The hypothesized value comes from the question (8 hours), not from a sample result.
6. A study measures reaction time for 20 sets of identical twins; one twin in each set is randomly assigned to drink coffee and the other water. Which analysis fits?
- A test comparing two independent groups of 20
- A paired t test on the 20 within-twin differences
- A one-sample t test on the 20 coffee times alone
- A one-proportion z test on the share of faster coffee twins
Show the answer
Matched pairs design: compute coffee minus water within each twin pair and test with a paired t test (df 19).
- A test comparing two independent groups of 20: The twins are matched, so the two groups are not independent.
- Correct: A paired t test on the 20 within-twin differences: Twins are matched pairs, so each pair gives one difference (coffee minus water), and the test is on the mean difference.
- A one-sample t test on the 20 coffee times alone: The water twins carry the comparison; leaving them out loses the point of the design.
- A one-proportion z test on the share of faster coffee twins: That throws away the size of each difference; the reaction times are quantitative.
Part 9 · Summary
Summary
Part 10 · Up next
What comes next
Part 11 · Connections