Is Norway "more developed" than South Sudan? Most people would say yes, but what exactly are we measuring: money, health, schooling, fairness? In geography, development means the process of improving the material conditions of people's lives: their income, health, education and choices. Because it has many parts, no single number captures it. Each measure shows some things and hides others, and the exam asks you to say which.
Measures of income and output
The first group of measures counts the value of goods and services an economy produces.
| Measure | What it counts |
|---|---|
| Gross domestic product (GDP) | The value of all goods and services produced inside a country's borders in a year, no matter who owns the firms |
| Gross national product (GNP) | The value produced by a country's people and firms, wherever in the world they produce it |
| Gross national income (GNI) | Nearly the same as GNP: all income earned by a country's residents, at home and abroad |
To compare countries of different sizes, divide by population. GNI per capita (per person) is GNI divided by the number of people. The World Bank uses it to sort countries into income groups each July. For the World Bank FY27 income groups (July 2026 to June 2027, using 2025 GNI per capita), a country is low income at $1,175 or less, lower-middle income from $1,176 to $4,635, upper-middle income from $4,636 to $14,375, and high income above $14,375 (World Bank, 2026). The lines move every year, so always name the year.
Prices differ from country to country, so a dollar buys more rice in Dhaka than in Oslo. Some measures adjust for this using purchasing power parity (PPP), which converts money into what it can actually buy locally.
What income measures hide
- Income distribution. GNI per capita is an average. A few very rich people can raise it while most people stay poor, so it says nothing about how income is shared.
- The informal sector. The formal sector is work that is registered, taxed and counted by the government. The informal sector (informal economy) is work that is not: a street vendor in Lagos, Nigeria, or a day laborer paid in cash. The International Labour Organization estimated that about 61% of the world's workers had informal jobs (ILO, 2018 report). Income measures miss much of this work.
- Unpaid work. Cooking, child care and farming for the family's own food add nothing to GDP, and women do most of it worldwide.
- Sectoral structure. The share of workers in each economic sector is itself a sign of development: a country where most people farm (primary) usually has lower incomes than one where most work in services.
Social and environmental measures
Other measures describe people's lives directly. You met several in Unit 2.
- Total fertility rate: usually lower where women have more schooling and paid work.
- Infant mortality rate: deaths of babies under one year per 1,000 live births; a strong sign of access to health care, clean water and food.
- Access to health care, such as doctors and hospital beds per person.
- Literacy rate: the share of adults who can read and write.
- Energy use: richer countries use more energy per person, and the mix matters too: how much comes from fossil fuels such as coal and oil, and how much from renewable sources such as wind, solar and hydropower.
Composite measures: HDI and GII
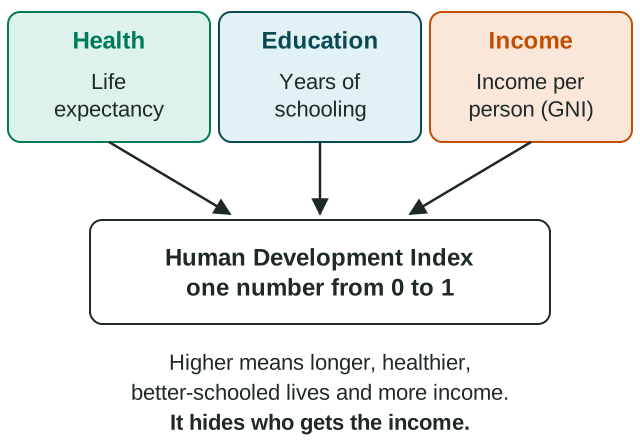
A composite index combines several measures into one number. The United Nations Development Programme (UNDP) publishes two that the exam names.
- The Human Development Index (HDI) combines three dimensions: a long and healthy life (life expectancy at birth), knowledge (expected and average years of schooling) and a decent standard of living (GNI per capita, PPP). It runs from 0 to 1. In the UNDP's 2025 report, which uses 2023 data, Iceland scored 0.972, Norway and Switzerland 0.970, and South Sudan 0.388 (UNDP, 2025).
- The Gender Inequality Index (GII) measures the gap between women and men in three dimensions: reproductive health (deaths of mothers in childbirth and births to teenagers), empowerment (seats held in parliament and secondary schooling) and the labor market (the share of women and men in paid work). Unlike HDI, a lower GII is better: 0 would mean no gap.
Composite indices are revised with each report, and back years are recalculated, so compare countries only within one edition, and teach the three dimensions rather than a rank order.
Worked example: what a measure hides, at two scales. At the national scale, India's HDI is one number. At the local (subnational) scale, state by state, Kerala in southern India has long had higher literacy and life expectancy than most other Indian states, though several Indian states have a higher income per person. A single national HDI hides that difference, so the scale of the data limits the conclusion you can draw.
Using measures well
On the exam, name the measure, say what it shows, then say one thing it hides. "GNI per capita shows average income, but it hides inequality and the informal sector." "HDI adds health and education to income, but as a national average it hides gaps between regions and between women and men, which the GII tries to capture."