The greenhouse effect is natural. What has changed is how much of each greenhouse gas is in the air. This page covers where the extra gases come from, how scientists measure them today and in the distant past, and how to describe and calculate the rise from real data.
Where the extra gases come from
| Gas | Main human sources |
|---|---|
| Carbon dioxide (CO₂) | burning coal, oil and natural gas (by far the largest); deforestation; making cement |
| Methane (CH₄) | cattle and other livestock; flooded rice paddies; landfills; leaks from natural gas wells and pipelines; coal mines |
| Nitrous oxide (N₂O) | nitrogen fertilizer on soils and manure (the largest); burning fuel; some industry |
| CFCs and HFCs | refrigerants, air conditioners and foams |
Methane forms wherever organic matter breaks down without oxygen: in cattle stomachs, under the water of a rice paddy and deep in a landfill. Deforestation adds CO₂ in two ways: burning or rotting trees release their stored carbon, and the lost forest can no longer absorb CO₂.
Natural sinks take some of it back. Plants and the ocean each absorb roughly a quarter of the CO₂ people release each year. The rest stays in the air, so the concentration keeps rising.
Measuring today's air: the Keeling curve
In 1958, Charles David Keeling began measuring CO₂ at Mauna Loa Observatory in Hawaii, high on a volcano and far from local pollution. NOAA continues the record today.
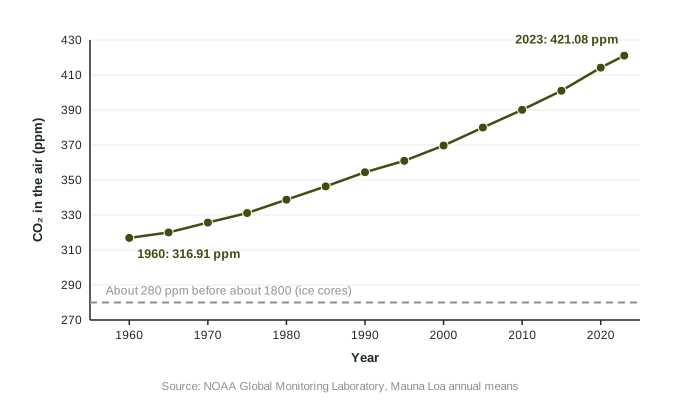
Two features stand out. The line rises every year, and it gets steeper: about 0.9 ppm a year in the 1960s, about 2.4 ppm a year in the 2010s. And within each year (not shown in yearly averages), CO₂ dips a few ppm in the Northern Hemisphere summer, when plants are growing, and rises in winter, when decomposition releases it. Most of Earth's land and plants are in the Northern Hemisphere, so its seasons set the rhythm.
Worked example. NOAA's annual mean at Mauna Loa was 316.91 ppm in 1960 and 414.21 ppm in 2020. By what percent did CO₂ rise?
Setup:
Answer: over 60 years.
Average rate from 2000 (369.71 ppm) to 2020:
Measuring past air: ice cores
In Antarctica and Greenland, snow piles up year after year and is pressed into ice. Tiny bubbles of air are sealed inside. Scientists drill out ice cores kilometers long and measure the gases in the bubbles, layer by layer, like reading a calendar of past air.
Ice cores show that over the last 800,000 years, CO₂ rose and fell with the ice ages, between about 180 ppm (cold periods) and about 300 ppm (warm periods). Just before the Industrial Revolution, around 1800, it was about 280 ppm. In 2023, NOAA's Mauna Loa annual mean was 421.08 ppm:
Describing a trend with data
Exam questions ask you to describe trends in graphs like this one. A full answer gives the direction, numbers with units, and any change in rate: "CO₂ increased every year, from about 317 ppm in 1960 to about 421 ppm in 2023, and the rate of increase grew from under 1 ppm a year to over 2 ppm a year." "CO₂ went up" earns less.
When asked why, link cause and effect: burning fossil fuels releases carbon that was stored underground for millions of years, adding CO₂ faster than plants and the ocean can remove it, so the concentration rises.