Adding greenhouse gases traps more heat, and Earth's average surface temperature has risen by about 1.1 °C since the late 1800s. That sounds small, but averaged over the whole planet it changes ice, oceans, weather and living things. This page covers the main effects, why sea ice and land ice are different, the feedback loops that amplify warming, and how to calculate a rate from data.
What changes as Earth warms
- Temperature: more heat waves and fewer cold extremes. The Arctic is warming about three to four times faster than the global average.
- Ice: glaciers retreat, the ice sheets of Greenland and Antarctica lose mass, Arctic sea ice shrinks and permafrost thaws.
- Sea level: global average sea level has risen roughly 20 cm since 1900, and the rate is speeding up. Low coasts and islands flood more often, and saltwater moves into fresh groundwater.
- Water cycle: warmer air evaporates more water and holds more vapor, so some regions get longer droughts and others heavier downpours. Storms can carry more rain.
- Living things: many species shift toward the poles or uphill to stay within their range of tolerance; spring events such as flowering come earlier; corals bleach in hot water; disease vectors spread.
Land ice raises sea level; sea ice does not
This is one of the most common exam mistakes. Sea ice is frozen seawater floating on the ocean, like the ice over the Arctic Ocean. A floating object pushes aside its own weight of water. When the ice melts, its water exactly fills the space it was already displacing, so sea level hardly changes. Try it: an ice cube melting in a full glass does not overflow.
Land ice sits on land: mountain glaciers and the huge ice sheets on Greenland and Antarctica. When it melts, or slides into the sea, water that was on land is added to the ocean, and sea level rises. The other main cause of sea level rise is that seawater takes up more space as it warms, covered in the next topic.
Melting sea ice still matters, but for a different reason: it changes albedo.
Positive feedback loops
A positive feedback loop is a chain in which the result of a change makes the change stronger. "Positive" means amplifying, not good.
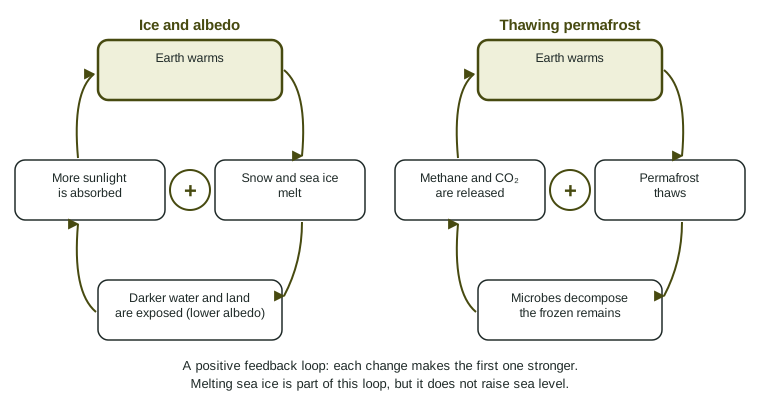
- Ice and albedo. Warming melts snow and sea ice. Darker water and land are exposed, so albedo falls. More sunlight is absorbed instead of reflected, causing more warming and more melting.
- Permafrost. Arctic permafrost holds huge amounts of frozen plant and animal remains. As it thaws, microbes decompose them, releasing CO₂ and methane. These gases trap more heat, thawing more permafrost.
There are negative feedbacks too, which slow a change. For example, more CO₂ can speed plant growth, which takes up some of the extra CO₂. But the positive feedbacks are why scientists worry about warming speeding up.
Calculating a rate from data
Worked example. A coastal town's tide gauge showed sea level 180 mm higher in 2020 than in 1900. What was the average rate of rise?
Setup:
Answer: . Divide the change by the number of years that passed, not by the year itself, and give the unit, mm per year.
Temperature data are often given as differences from a baseline average, such as "+0.40 °C compared with 1951 to 1980". A negative value means cooler than that average, not below freezing. To find a change, subtract the earlier value from the later one: from 0.26 °C in 1980 to 1.01 °C in 2020 is °C.
Who is most at risk
People in low-lying coastal areas and on islands such as the Maldives, much of which is less than 1 meter above sea level, face flooding and the loss of fresh water. Farmers in regions where droughts grow longer face crop losses. In general, communities with fewer resources to adapt face greater harm, even though they released the least greenhouse gas.
On the exam
Expect to explain an effect with a full chain of links, to identify a feedback loop, and to keep sea ice and land ice apart. When describing data, give the direction, numbers with units and any change in rate.