Global Climate Change
More greenhouse gases warm Earth.
Part 1 · Hook
Why this matters
Part 2 · Before you start
What this builds on
Part 3 · Prerequisite check
Quick check before you start
1. What happens to Earth’s surface when greenhouse gases increase?
- More heat is trapped, so it warms
- More UV reaches it, so it cools
- Less sunlight reaches it
- Nothing changes
Show the answer
More greenhouse gas absorbs more infrared, sending more heat back down.
- Correct: More heat is trapped, so it warms:
- More UV reaches it, so it cools:
- Less sunlight reaches it:
- Nothing changes:
2. What is albedo?
- The share of sunlight a surface reflects
- The amount of CO₂ in the air
- The angle of Earth’s axis
- The speed of the trade winds
Show the answer
Albedo measures reflection: snow is high, dark water is low.
- Correct: The share of sunlight a surface reflects:
- The amount of CO₂ in the air:
- The angle of Earth’s axis:
- The speed of the trade winds:
Part 4 · See it
See it first
Part 5 · Step by step
How it works, step by step
- More greenhouse gases trap more heatglobal average temperature rises (about 1.1 °C since the late 1800s)
- Warming melts glaciers and the ice on Greenland and Antarcticawater flows into the ocean and sea level rises
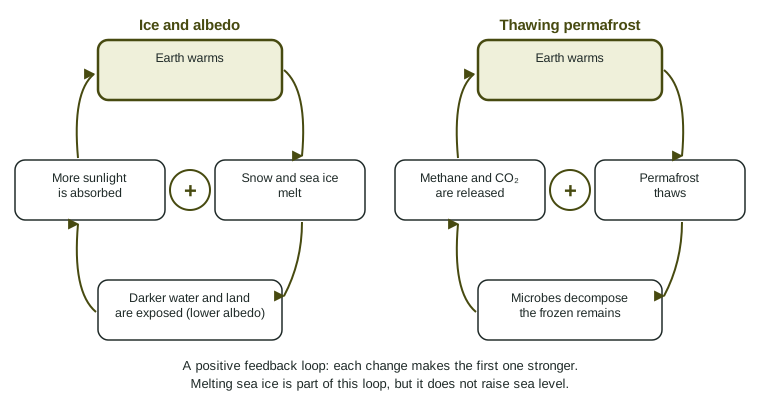
- Warming melts sea ice and thaws permafrostalbedo falls and stored carbon is released: positive feedback loops amplify warming
- A warmer climate shifts heat, rainfall and stormsheat waves, droughts, heavy rain and species range shifts become more common
Part 6 · Key ideas
Key ideas
- Climate change: long-term change in Earth’s climate, now mainly warming caused by added greenhouse gases.
- Sea level rise comes from melting land ice (glaciers, ice sheets) and from warming water taking up more space. Melting sea ice does not raise sea level, because it already floats.
- A positive feedback loop amplifies a change: melting ice lowers albedo; thawing permafrost releases methane and CO₂.
- Effects: heat waves, shifts in rainfall, stronger storms, coastal flooding, coral bleaching, species moving toward the poles.
Part 7 · Misconception
A common mistake
The wrong idea: Melting Arctic sea ice is the main reason sea level is rising.
What actually happens: Sea ice floats, so it already displaces its own weight of water. Melting it barely changes sea level. Sea level rises from melting land ice and from ocean water expanding as it warms. Sea ice matters because losing it lowers albedo.
Part 8 · Check yourself
Check yourself
Exam-style questions. Anything you miss goes into your review queue.
1. Which change would raise global sea level?
- Melting of land ice on Greenland
- Melting of floating Arctic sea ice
- More snowfall staying on Antarctica
- Thicker sea ice around Antarctica
Show the answer
Land ice (glaciers and the ice on Greenland and Antarctica) adds water to the ocean when it melts; floating sea ice does not.
- Correct: Melting of land ice on Greenland: Right: water from land ice flows into the ocean and adds to its volume.
- Melting of floating Arctic sea ice: Sea ice already floats and displaces its own weight of water, so melting it barely changes sea level.
- More snowfall staying on Antarctica: Snow piling up on land holds water out of the ocean, so it lowers sea level slightly.
- Thicker sea ice around Antarctica: Floating ice does not change sea level as it grows or shrinks.
2. An ice cube floats in a full glass of water. When it melts, what happens to the water level?
- It rises and overflows
- It stays about the same
- It falls below the rim
- It rises by the ice’s volume
Show the answer
This is why melting sea ice does not raise sea level, while melting land ice does.
- It rises and overflows: The ice already pushed aside its weight of water; melting fills that same space.
- Correct: It stays about the same: Right: floating ice displaces its own weight of water, which is what it adds when it melts.
- It falls below the rim: The meltwater exactly fills the space the floating ice displaced.
- It rises by the ice’s volume: Only the underwater part of the ice displaced water, and that is what the meltwater fills.
Data
Global temperature differences from a 1951 to 1980 average
| Year | Difference from average (°C) |
|---|---|
| 1900 | -0.18 |
| 1920 | -0.27 |
| 1940 | 0.12 |
| 1960 | -0.03 |
| 1980 | 0.26 |
| 2000 | 0.40 |
| 2020 | 1.01 |
3. Describe the trend in the temperature data from 1960 to 2020.
- It rose by about 1 °C
- It fell by about 1 °C
- It stayed about the same
- It rose, then fell back to 1960 levels
Show the answer
Read the endpoints and give the change with its unit: about 1.0 °C warmer.
- Correct: It rose by about 1 °C: Right: from −0.03 to 1.01 °C, a rise of about 1.04 °C.
- It fell by about 1 °C: The values increase from 1960 to 2020.
- It stayed about the same: A change from −0.03 to 1.01 °C is large for a global average.
- It rose, then fell back to 1960 levels: The last value, in 2020, is the highest.
4. By how many degrees Celsius did the temperature difference increase from 1980 to 2020?
Type a number, then its unit (°C). Scale words (2.5 million) and powers of ten (2.5 × 10^6) are read.
Show the answer
- Answer: 0.75 °C
5. What does a value of −0.27 °C in 1920 mean?
- The average temperature was below freezing
- Temperatures fell by 0.27 °C that year
- That year was 0.27 °C cooler than the baseline
- The data for 1920 are missing
Show the answer
An anomaly is a difference from a baseline average; negative means cooler than that average.
- The average temperature was below freezing: The value is a difference from an average, not the temperature itself.
- Temperatures fell by 0.27 °C that year: It compares the year with a fixed baseline, not with the year before.
- Correct: That year was 0.27 °C cooler than the baseline: Right: the values are differences from a 1951 to 1980 average.
- The data for 1920 are missing: A negative number is a measured difference, not missing data.
6. Which statement about the data is supported?
- Global temperature rose in each 20-year step since 1900
- Temperature will reach 2 °C above the baseline by 2030
- The data show that the Sun caused the warming
- Warming since 1980 is faster than in earlier decades
Show the answer
Use the data for claims they support: a faster rise after 1980. Do not claim a cause the table does not show.
- Global temperature rose in each 20-year step since 1900: It fell from 1900 to 1920 and from 1940 to 1960.
- Temperature will reach 2 °C above the baseline by 2030: The data cannot support that exact prediction.
- The data show that the Sun caused the warming: The table shows temperature, not its cause.
- Correct: Warming since 1980 is faster than in earlier decades: Right: 0.75 °C in 40 years after 1980, compared with smaller and uneven changes before.
7. Why do low-lying island nations such as the Maldives face especially high risk from climate change?
- They release the most greenhouse gases
- Their sea ice is melting fastest
- Most of their land is close to sea level
- They lie under the ozone hole
Show the answer
Much of the Maldives is less than 1 meter above sea level, so rising seas and storm surges threaten homes and fresh water.
- They release the most greenhouse gases: Small island nations release very little.
- Their sea ice is melting fastest: Tropical islands do not have sea ice.
- Correct: Most of their land is close to sea level: Right: a small rise in sea level floods a large share of their land.
- They lie under the ozone hole: The ozone hole is over Antarctica.
Part 9 · Summary
Summary
Part 10 · Up next
What comes next
Part 11 · Connections