The collision model (topic 5.5) says a collision needs at least the activation energy to react. An energy profile shows where that energy goes. It follows the potential energy of the reacting particles as they turn from reactants into products.
Reading an energy profile
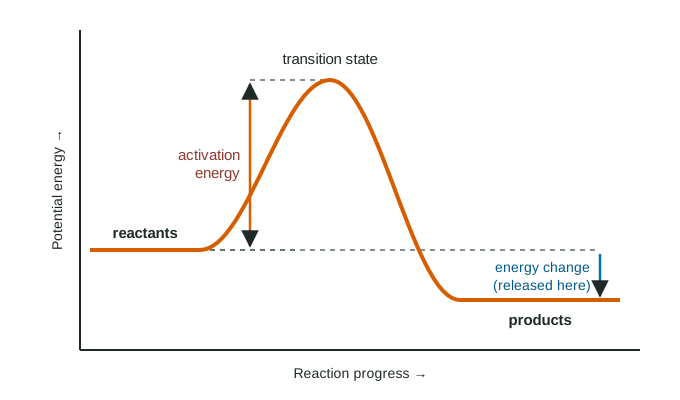
- The vertical axis is potential energy, usually in kJ/mol.
- The horizontal axis is the reaction coordinate: how far the atoms have moved from the reactant arrangement toward the product arrangement. It is not time.
- The left plateau is the reactants; the right plateau is the products.
- The peak is the transition state (also called the activated complex): the highest-energy arrangement along the path, with old bonds partly broken and new bonds partly formed. It lasts about as long as one molecular vibration and cannot be isolated.
Two energies you read off the graph
Activation energy (Ea): the rise from the reactants to the transition state.
Ea = E(transition state) − E(reactants)
Energy change of the reaction: the difference between the products and the reactants.
energy change = E(products) − E(reactants)
If the products are lower, the change is negative and energy is released. If the products are higher, the change is positive and energy is absorbed. Unit 6 gives these energy changes their names and units in detail.
Worked example: reading a profile
Reactants at 30 kJ/mol, transition state at 120 kJ/mol, products at 60 kJ/mol.
Forward Ea = 120 − 30 = 90 kJ/mol.
Energy change = 60 − 30 = +30 kJ/mol. The products are higher, so the reaction absorbs 30 kJ/mol.
Reverse Ea: run in reverse, the reaction starts at the products and climbs the same hill: 120 − 60 = 60 kJ/mol.
Check: Ea(forward) − Ea(reverse) = 90 − 60 = +30 kJ/mol, the energy change.
Forward and reverse barriers
A reaction and the same reaction run in reverse pass through the same transition state. So
energy change (forward) = Ea(forward) − Ea(reverse)
A reaction that releases energy has a smaller forward barrier than reverse barrier; one that absorbs energy has the opposite.
Barrier height and rate
At a given temperature, the energy distribution of the molecules is fixed. A higher barrier means a smaller fraction of collisions can clear it, so the rate constant k is smaller and the reaction is slower.
The overall energy change does not set the rate. A reaction can release a great deal of energy and still be extremely slow if its barrier is high. Wood and the oxygen in air are an example: burning releases a lot of energy, but a log does not catch fire until a flame supplies enough energy to start it.
| Feature | What it tells you |
|---|---|
| Height of the barrier above the reactants (Ea) | How fast: higher barrier, smaller k, slower |
| Products minus reactants | How much energy is released or absorbed; not how fast |
| Peak | The transition state, the least stable point on the path |