Topic 5.6 drew the energy profile of a single step: one hill. A mechanism with several steps has one hill for each step. Reading that profile tells you how many steps there are, where the intermediates sit, and which step is slowest.
One hump per step
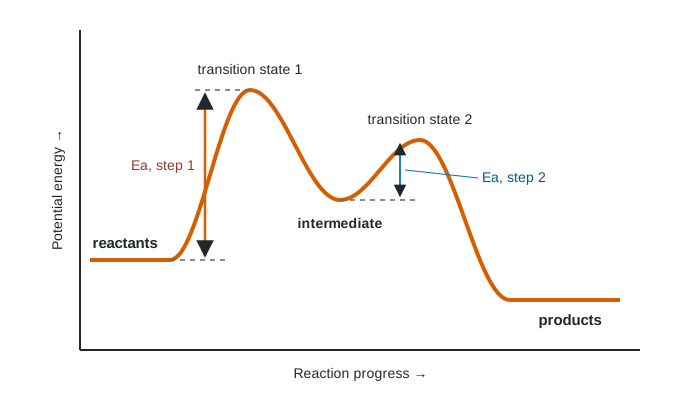
- Each peak is the transition state of one elementary step.
- Each valley between two peaks is an intermediate: a real species made by one step and used by the next.
- A mechanism with n steps has n peaks and n − 1 valleys between them.
- The overall energy change is still products minus reactants. Intermediates and transition states do not change it.
Each step's barrier starts where that step starts
The activation energy of a step is measured from the level that step starts at to its own peak. Step 1 starts at the reactants; step 2 starts at the first intermediate; and so on.
Worked example: reading a two-step profile
Levels: reactants 50, transition state 1 at 140, intermediate 80, transition state 2 at 110, products 20 (all kJ/mol).
Step 1 Ea = 140 − 50 = 90 kJ/mol.
Step 2 Ea = 110 − 80 = 30 kJ/mol.
Slow step: step 1, the larger barrier.
Overall energy change = 20 − 50 = −30 kJ/mol (energy released).
Rate law: if step 1 is A + B → C, the slow first step gives rate = k[A][B] (topic 5.8).
Which step is rate-determining?
Compare the barriers: the step with the largest activation energy, measured from its own starting level, is usually the slowest. Often that step also has the highest transition state on the whole graph, but not always: after a deep valley, a lower peak can still be the biggest climb. Compare the barriers.
Two traps:
- The first step is not slowest by rule. A deep valley (a very stable intermediate) followed by a tall peak makes a later step slow.
- Do not measure every barrier from the reactants. A later step starts from an intermediate.
| You want | Read |
|---|---|
| Number of steps | Number of peaks |
| Intermediates | Valleys between peaks |
| Ea of a step | Its peak minus the level it starts from |
| Slow step | The step with the largest Ea |
| Overall energy change | Products minus reactants |
Worked example: a three-step profile from a table
Levels in order (kJ/mol): reactants 10, TS1 70, intermediate 1 at 25, TS2 60, intermediate 2 at −30, TS3 55, products −45.
Barriers: step 1 = 70 − 10 = 60; step 2 = 60 − 25 = 35; step 3 = 55 − (−30) = 85 kJ/mol.
Slow step: step 3, with the largest barrier. Its peak (55) is not the highest point on the graph (TS1 is at 70), which is why you compare barriers, not peak heights alone.
Counts: three peaks (transition states) and two valleys (intermediates).
Overall change: −45 − 10 = −55 kJ/mol.
Linking the profile to the rate law
Once you know the slow step, the rules of topics 5.8 and 5.9 give the rate law. If the slow step is first, the rate law is that step's rate law. If a fast step comes first, its products feed the slow step, and you use the pre-equilibrium approximation to replace the intermediate.