Constructing a Confidence Interval for a Population Proportion
A confidence interval for p is p-hat ± z*√(p-hat(1 − p-hat)/n) : the point estimate plus or minus a margin of error.
Part 1 · Hook
Why this matters
Part 2 · Before you start
What this builds on
Part 3 · Prerequisite check
Quick check before you start
1. If and , what is ?
- 0.025
- 0.000625
- 0.5
- 0.25
Show the answer
- Correct: 0.025:
- 0.000625:
- 0.5:
- 0.25:
2. Under the standard normal curve, what value has an area of 0.975 below it?
- 1.96
- 1.645
- 2.576
- 0.975
Show the answer
, so 95% of the area lies between and .
- Correct: 1.96:
- 1.645:
- 2.576:
- 0.975:
Part 4 · See it
See it first
Part 5 · Step by step
How it works, step by step
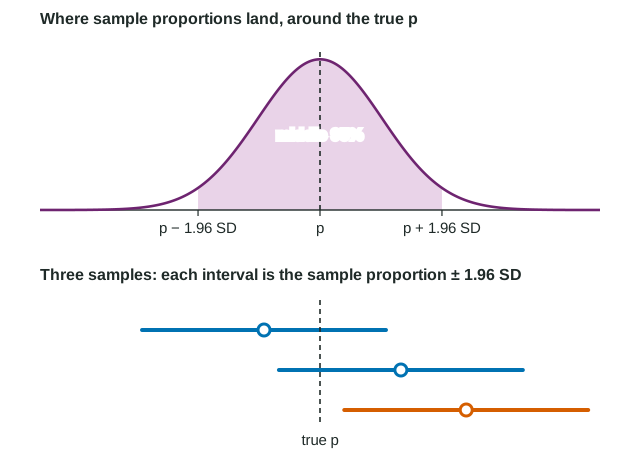
- is approximately normal, centered at in 95% of random samples, lands within 1.96 standard deviations of
- Turn that aroundin 95% of samples, is within 1.96 standard deviations of
- We do not know , so the standard deviation cannot be computedwe use the standard error in its place
- Go standard errors out on each side of captures for the stated share of samples
Part 6 · Key ideas
Key ideas
- Interval = statistic ± (critical value)(standard error). For one proportion: .
- : 1.645 for 90%, 1.96 for 95%, 2.576 for 99%. Area below is .
- Conditions in words: random sample; at most 10% of the population; at least 10 successes and 10 failures in the sample.
- Margin of error . It shrinks with a larger (4 times halves it) and grows with the confidence level.
- Name the procedure in full: one-sample z interval for a proportion.
Part 7 · Misconception
A common mistake
The wrong idea: For a 90% interval, find the with 0.90 of the area below it, so .
What actually happens: A 90% interval keeps 90% in the middle and leaves 5% in each tail, so has 0.95 below it: .
Part 8 · Check yourself
Check yourself
Exam-style questions. Anything you miss goes into your review queue.
Table
Skipping breakfast at a large university
A dietitian at a university with 28,000 students selects a random sample of 400 students. Of them, 248 say they regularly skip breakfast. She wants to estimate the proportion of all students at the university who regularly skip breakfast.
| Response | Number of students |
|---|---|
| Regularly skip breakfast | 248 |
| Do not | 152 |
| Total | 400 |
1. Which statement correctly checks the large counts condition for a confidence interval?
- 248 skip and 152 do not, and both are at least 10
- is at least 30
- 400 is less than 10% of 28,000
- is at least 10
Show the answer
For an interval, is unknown, so check the observed successes and failures: and , both at least 10.
- Correct: 248 skip and 152 do not, and both are at least 10: Right: for an interval, check the sample's successes and failures.
- is at least 30: The rule of 30 is about means. For a proportion, check successes and failures.
- 400 is less than 10% of 28,000: That is the 10% condition, which is about independence, not the normal shape.
- is at least 10: No value of 0.5 is claimed here. For an interval, use the sample's counts, 248 and 152.
2. Calculate the standard error of . Give four decimal places.
Type a number. A table answer and a calculator answer are both accepted.
Show the answer
and
- Answer: 0.0243
3. Calculate the margin of error for a 95% confidence interval for the proportion of all students who regularly skip breakfast. Give four decimal places.
Type a number. A table answer and a calculator answer are both accepted.
Show the answer
- Answer: 0.0476
4. Construct a 95% confidence interval for the proportion of all students at the university who regularly skip breakfast.
Type the interval as "from a to b".
Show the answer
- Answer: from 0.572 to 0.668
5. Type the 95% confidence interval as an expression with the values substituted: the point estimate, then +/-, then the margin of error.
Type the expression as on the exam, with the values substituted.
Show the answer
Statistic (critical value)(standard error): .
- Answer:
6. Find the critical value for a 90% confidence interval. Give three decimal places.
Type a number. A table answer and a calculator answer are both accepted.
Show the answer
A 90% interval leaves 5% in each tail, so has 95% of the standard normal area below it: .
- Answer: 1.645
7. The dietitian's 95% confidence interval for the proportion of all students at her university who regularly skip breakfast runs from 0.572 to 0.668. Build the interpretation of this interval.
Write the conclusion in context.
Show the answer
The interpretation names the confidence level, the interval, and the parameter in context: the proportion of all students at the university, not the 400 in the sample.
- A full-credit answer: We are 95% confident that the interval from 0.572 to 0.668 captures the true proportion of all students at the university who regularly skip breakfast.
Part 9 · Summary
Summary
Part 10 · Up next
What comes next
Part 11 · Connections