
Inflation for a few months can come from many places: a jump in oil prices, a spending boom. Inflation that runs high for years has one main source: the money supply growing much faster than the economy's output. This topic gives the tool that shows why, the quantity theory of money, and the idea behind it, that money is neutral in the long run.
The equation of exchange
Every dollar spent on final goods and services is a dollar of nominal GDP. Count it two ways and you get one identity:
- M is the money supply.
- V is the velocity of money: the average number of times a dollar is spent on final goods and services in a year.
- P is the price level and Y is real output (real GDP), so is nominal GDP.
The left side is the money people spend; the right side is the value of what they buy. Solving for velocity gives : nominal GDP per dollar of money.
Worked example: velocity and the price level. An invented economy has a money supply of 400 billion dollars, nominal GDP of 2,000 billion dollars and real GDP of 1,600 billion base-year dollars.
- Velocity. . Each dollar is spent on final output about five times a year.
- The price level.
, so prices are 25 percent above the base year. - A change. If M rises to 480 billion dollars (20 percent) while V stays at 5 and Y at 1,600, then
: the price level rises 20 percent too.
From an identity to a theory
The equation is always true. It becomes the quantity theory of money when you add two long-run assumptions:
- Velocity is roughly steady. How often people spend each dollar depends on payment habits and technology, which change slowly.
- Real output is set by resources and technology. In the long run the economy produces at full employment, on LRAS, whatever the amount of money.
With V and Y fixed, the only thing left to move when M rises is P. The price level rises in proportion to the money supply. In growth rates the same idea reads:
If money grows 7 percent a year, velocity is steady and real output grows 3 percent, inflation is about percent. Output growth absorbs some of the new money; the rest raises prices.
Money is neutral in the long run
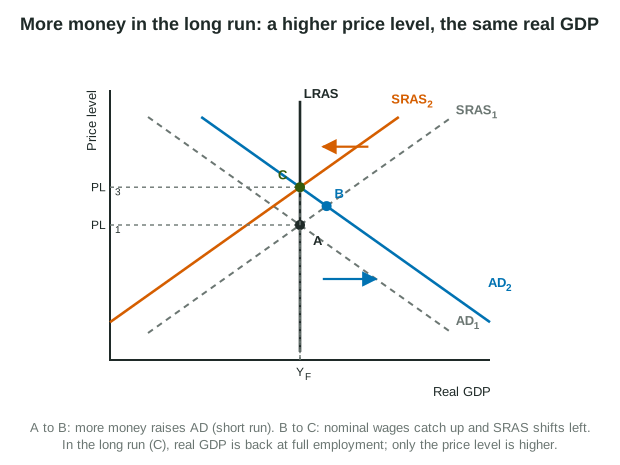
The AD-AS graph shows the same result. Start at full employment. A rise in the money supply lowers interest rates, investment and consumption rise, and AD shifts right: in the short run real GDP and the price level both rise. Output above full employment then pushes nominal wages up, so SRAS shifts left until output is back at full employment. The end point sits on LRAS with a higher price level and the same real GDP.
That is the long-run neutrality of money: a change in the money supply changes only nominal variables in the long run, and leaves real ones alone.
| Changed by money in the long run (nominal) | Not changed by money in the long run (real) |
|---|---|
| The price level and the inflation rate | Real GDP (full-employment output) |
| Nominal GDP | The natural rate of unemployment |
| Nominal wages | Real wages |
| Nominal interest rates (through expected inflation) | The real interest rate |
In the short run, money is not neutral: sticky wages and prices let a change in AD move real output and unemployment, which is why monetary policy can fight a recession at all.
Very fast money growth
When a government pays its bills by having the central bank create money, the money supply can grow far faster than output and inflation can become extreme, as in Germany in 1923 or Zimbabwe in 2008. As people come to expect high inflation, lenders add it to the interest rates they charge, so nominal interest rates rise even though the real rate has not changed. People also spend money faster before it loses value, which raises velocity and pushes prices up further.
Slip to avoid: treating new money as new output. Money is a claim on goods, not a good: doubling it in the long run doubles the price level, not real GDP.