
The previous topic ended with a question: when a government borrows to cover a deficit, where does the money come from? It comes from the same pool of saving that firms borrow from to build factories and buy equipment. When the government takes more of that pool, the price of borrowing rises, and some private projects no longer pay. That is crowding out, and it is the main long-run cost readers ask about when a question links deficits to investment and growth.
Crowding out on the loanable funds graph
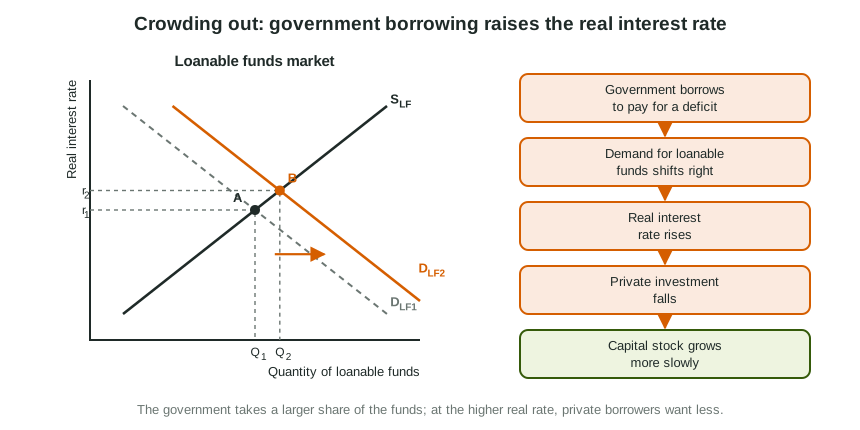
Draw the loanable funds market with the Real interest rate on the vertical axis and the Quantity of loanable funds on the horizontal axis. Supply (SLF) comes from saving and slopes up; demand (DLF) comes from borrowers and slopes down. Never write "nominal" on this graph: savers and investors care about the real return, after inflation.
Worked example: show crowding out. A government at full employment raises its spending and borrows to pay for it.
- Which curve? The government is a new borrower, so the demand for loanable funds shifts right, from DLF1 to DLF2.
- New equilibrium. DLF2 crosses SLF higher up: the real interest rate rises from r1 to r2, and the quantity of loanable funds rises from Q1 to Q2.
- Who gets the funds? The total quantity is larger, but the government takes more than the increase. At the higher real rate, private firms move up along their own demand and borrow less.
- The result. Private investment falls: it has been crowded out.
Some textbooks draw the same event on the supply side: a deficit is negative public saving, so national saving falls and SLF shifts left. The real interest rate rises in both pictures. On an exam, either view earns the point if the graph is labeled and the explanation matches it; when a question says which curve to use, use it.
The chain, every link
- The government spends more than it collects and borrows the difference.
- The demand for loanable funds rises.
- The real interest rate rises.
- Borrowing costs more, so private investment, and interest-sensitive consumption such as car and home purchases, falls.
- In the short run, that fall offsets part of the rise in AD from the government's spending.
- Over many years, lower investment adds fewer factories, machines and equipment, so the capital stock grows more slowly, and so does potential output.
Slip to avoid: saying deficit spending lowers interest rates, or jumping from "deficit" to "less investment" without the real interest rate in between. Readers report both as common reasons for lost points.
Short run and long run
| Short run | Long run | |
|---|---|---|
| What deficit spending does | Raises AD; output and the price level rise | Leaves a higher real interest rate while the borrowing lasts |
| What crowding out does | Lowers private investment, so AD rises by less than the multiplier alone would give | A smaller capital stock than otherwise, so potential output grows more slowly |
Suppose government spending rises by 100 billion dollars, the higher real rate cuts investment by 40 billion dollars, and the multiplier is 5. The net new spending is 60 billion dollars, so AD rises by at most 300 billion dollars, not 500 billion.
How large is crowding out?
It depends on how far the real interest rate rises.
- Near full employment, private firms are borrowing actively and saving is stretched, so the government's extra demand pushes the real rate up a lot. Crowding out is large.
- In a deep recession, many firms have stopped borrowing and saving is plentiful, so the same borrowing raises the real rate less. Crowding out is smaller.
- More private saving, or funds flowing in from abroad, shifts supply right and limits the rise in the real rate.
Crowding out also depends on what the government buys. Borrowing to pay for current services adds nothing to the capital stock, so the lost private investment is a net loss of capacity. Borrowing to build roads or train workers adds capital of another kind, a link the growth topics take up next.