
Who counts as unemployed
Having no job does not make you unemployed in the statistics. Every month a government survey sorts the adult population (people 16 and older who are not in an institution such as a prison and not on active military duty) into three groups:
- Employed: did any paid work in the survey week, full-time or part-time.
- Unemployed: has no job, is available to work, and looked for work in the past four weeks.
- Not in the labor force: everyone else, such as retirees, full-time students who are not job hunting, people caring for family at home, and discouraged workers, who want a job but have stopped looking because they believe none is available.
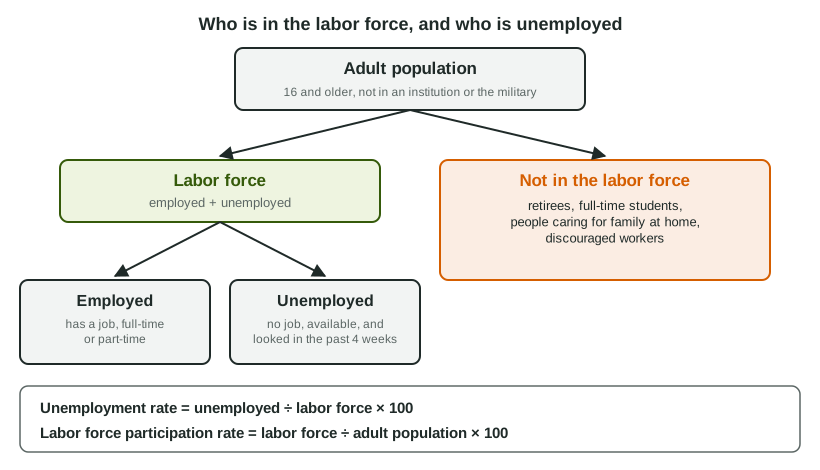
The labor force is the employed plus the unemployed. Two rates come from these groups:
Worked example: the two rates (invented data, millions of people).
Country X: adult population 250, employed 150, unemployed 10, not in the labor force 90.
Labor force. million.
Unemployment rate. .
Participation rate. .
The slips: dividing the unemployed by the adult population (4%) or by the employed (6.67%), and forgetting to multiply by 100 (0.0625).
Why the official rate understates joblessness
Discouraged workers are outside the labor force, so they do not raise the unemployment rate even though they want work. If Country X's 2 million discouraged workers were counted as unemployed, the rate would be . Underemployed workers, people working part-time who want full-time work or working well below their skills, count as employed. Both make the official rate a low reading of how much labor goes unused.
The rate can also move for reasons other than layoffs. When students finish school and start looking, they join the labor force as unemployed, so the rate can rise with no one losing a job. When jobless people give up looking, the rate can fall even though nobody found work.
Three types of unemployment
| Type | Cause | Example |
|---|---|---|
| Frictional | Time spent searching between jobs or entering the labor force | A nurse who moved and is applying for nursing jobs; a new graduate's search |
| Structural | Skills or locations do not match the jobs available, often after technology or demand changes | A press operator whose plant went digital and whose nearby openings need computer skills |
| Cyclical | A fall in total spending and output during a downturn | A car salesperson laid off when sales fell in a recession |
Frictional unemployment is partly healthy: it lets people find jobs that fit them. Structural unemployment lasts longer, because the worker needs new skills or must move.
The natural rate and full employment
Frictional and structural unemployment never disappear, so the natural rate of unemployment is
and the actual rate is the natural rate plus cyclical unemployment:
When cyclical unemployment is zero, the actual rate equals the natural rate and the economy is at full employment. Full employment is not 0% unemployment. The natural rate is not fixed either: better job search tools can lower frictional unemployment, and fast changes in technology can raise structural unemployment.
Worked example: natural and cyclical unemployment (invented data).
Country Z has frictional unemployment of 2.0% and structural unemployment of 3.0%. Its actual rate is 8.0% in Year 2.
Natural rate. .
Cyclical rate. .
If the actual rate were 4.5%, cyclical unemployment would be : the economy would be producing beyond full employment for a while. The slip readers see most is adding the actual and natural rates.
Unemployment on the production possibilities curve
Workers who want jobs but cannot find them are idle resources. An economy with cyclical unemployment produces at a point inside its PPC: it could make more of both goods by putting those workers to work. A lasting rise in the labor force (more adults working) is more of a factor of production, which shifts the PPC out.