
A great measure of output, an imperfect measure of well-being
GDP is the market value of final goods and services produced in a country in a year. It is the best single number for how much an economy produces, and economists use it constantly. But GDP was built to measure market production, not happiness or welfare. Anything without a market price, anything that goes unreported, and anything that makes life better or worse without being sold slips past it.
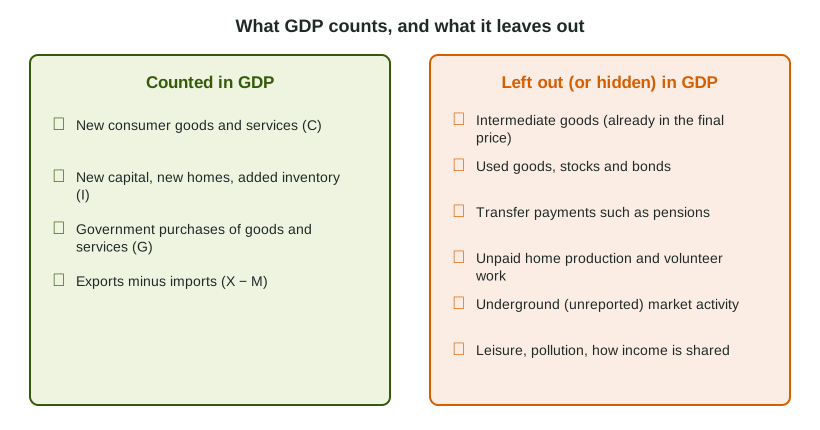
Production GDP misses
Nonmarket activity. When you cook dinner for your family, mow your own lawn or volunteer at a food bank, you produce something of value, but no one pays a market price for it, so GDP leaves it out. If Omar quits his job as a restaurant cook to cook the same amount at home for his own family, measured GDP falls even though about as much food is made.
The underground (informal) economy. Some market work is paid in cash and never reported: house painting, street vending, tutoring, as well as illegal trade. It is real production, but statisticians cannot see it, so official GDP understates what the country produces. Where the underground economy is large, official GDP makes the country look poorer than it is. And if unreported sellers start registering their businesses, measured GDP rises even though they sell exactly what they did before: the measurement changed, not the output.
What GDP cannot show about well-being
- Leisure. More free time makes people better off, but it has no market price. Two more weeks of vacation can lower measured output while people are happier.
- The environment. GDP adds up spending without asking what it is for. A chemical spill that forces towns to pay for a cleanup raises GDP (the cleanup is a paid service), while the harm to the river is never subtracted.
- Quality. GDP counts prices paid. A phone that costs what it did ten years ago but does far more adds the same value to GDP, so quality gains can be missed.
- How income is shared. GDP is a total. It says nothing about whether output goes to a few people or to many.
- Health, safety and the rest of life. Life span, crime and clean air matter to well-being and are outside GDP.
GDP per capita: adjusting for size
A country with more people produces more in total for that reason alone. To compare material living standards, divide by population: GDP per capita is output per person.
Worked example: comparing three countries (invented data).
| Country | GDP (billions of dollars) | Population (millions) | GDP per capita |
|---|---|---|---|
| Halvet | 800 | 40 | thousand dollars |
| Berovia | 300 | 10 | thousand dollars |
| Cestia | 1,200 | 80 | thousand dollars |
Units. Billions divided by millions gives thousands, so Halvet's GDP per capita is 20,000 dollars, not 20.
Reading it. Cestia has the largest economy but the lowest output per person; Berovia has the smallest economy but the highest output per person.
Per capita figures also explain changes over time. If GDP grows 2% in a year while the population grows 3%, GDP per capita falls: output per person rises only when output grows faster than the population.
GDP per capita is still an average. If most income goes to a small share of people, the typical person can be much worse off than the average suggests, and the measure still leaves out leisure, home production and the environment.
Using GDP well
On the AP® Macroeconomics exam, a question about the limits of GDP usually wants you to name what is left out (nonmarket or underground activity, leisure, environmental harm, quality, distribution) and say which way it biases the number. Missing production makes GDP understate output; counting a cleanup without the damage makes GDP overstate well-being. And when comparing countries of different sizes, always divide by population first.