
Left alone, an economy closes its output gaps through wages and SRAS, but slowly. A government can act faster on the demand side. Fiscal policy is the use of government purchases, taxes and transfer payments to shift aggregate demand. This page shows which way to move each tool, how far, and what the graph looks like.
The three tools
- Government purchases (G): roads, schools, defense, public workers' salaries. They are part of AD directly, so they work through the spending multiplier, 1 / MPS.
- Taxes: a tax cut raises disposable income, households spend the MPC share of it, and AD rises through the tax multiplier, -MPC / MPS.
- Transfer payments: money paid to households with no good or service bought in return, such as pensions, aid to families or unemployment benefits. They are not part of G. A rise in transfers raises disposable income just as a tax cut does, so its effect on output is MPC / MPS times the transfer.
Discretionary fiscal policy means a deliberate decision by the government (passing a spending bill, changing tax rates), as opposed to changes that happen by themselves, which the next topic covers.
Which way: expansionary or contractionary
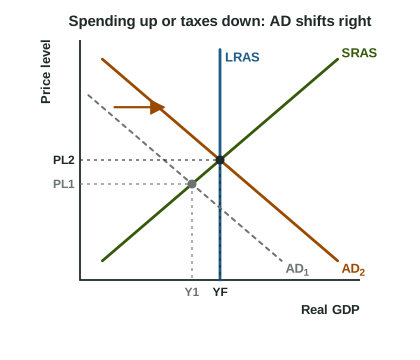
| Expansionary fiscal policy | Contractionary fiscal policy | |
|---|---|---|
| Used for | a recessionary gap (output below YF) | an inflationary gap (output above YF) |
| Actions | raise G, cut taxes, raise transfers | cut G, raise taxes, cut transfers |
| AD | shifts right | shifts left |
| Short-run effects | real GDP and the price level rise; unemployment falls | real GDP and the price level fall; unemployment rises toward the natural rate |
The chain for a tax cut, with every link: taxes fall, so disposable income rises, so consumption rises, so AD shifts right (by a multiple of the first rise in spending), so real GDP and the price level rise and unemployment falls (the graph). For a rise in G, skip the first two links: G is spending already.
How far: divide the gap
Worked example. Country J has a recessionary gap of 100 billion dollars and an MPC of 0.8.
- Multipliers: MPS ; spending multiplier ; tax multiplier .
- Direction: output is too low, so expansionary: raise G, cut taxes or raise transfers.
- Raise G by billion dollars.
- Or cut taxes by billion dollars, or raise transfers by the same 25.
- Check a wrong proposal: cutting taxes by only 20 raises output by , short of the gap.
For an inflationary gap, the same steps run the other way. Velora's output is 60 billion dollars above YF with an MPC of 0.75: cut G by or raise taxes by billion dollars.
Common slips: multiplying the gap by the multiplier instead of dividing; using the spending multiplier for a tax or transfer change; and counting transfer payments as government purchases. A fourth: shifting SRAS for a tax cut on households. Income taxes and government purchases change spending, so they shift AD.
Fiscal policy against waiting
Both routes end at full-employment output, but at different price levels. Expansionary fiscal policy moves AD right along SRAS, so the price level rises as the gap closes. Self-adjustment moves SRAS right along AD, so the price level falls. Fiscal policy is faster in principle, but it has lags: it takes time to see that a recession has started, to agree on a policy, and to get the money spent. If the economy has begun to recover by the time the spending arrives, the extra AD can push output past YF into an inflationary gap. Those lags, and how large the effects are, are part of real debates about policy; the model shows the trade-offs, not which choice is right.