Up to now you have gone from an amount to its rate: from position to velocity, from water in a tank to how fast it flows. Unit 6 turns that around. Given the rate, how much has built up? The answer is a single idea that the rest of the course leans on: the change in an amount is the area under its rate graph.
Constant rates: rate times time
Start with what you already know. A car that drives at 60 miles per hour for 2 hours goes 120 miles. Draw that rate as a graph against time: a flat line at height 60 from to . The region under it is a rectangle 2 wide and 60 tall. Its area is 120, the same multiplication.
That is not a coincidence. Height times width is rate times time, and rate times time is the change in the amount. The units agree: (miles per hour) times (hours) = miles. Area under a rate graph has the units of the rate times the units of the input.
| Rate (height) | Input (width) | Area means |
|---|---|---|
| velocity, feet per second | seconds | change in position, feet |
| flow, liters per minute | minutes | change in water, liters |
| temperature change, degrees per hour | hours | change in temperature, degrees |
| people entering, people per hour | hours | number of people who enter |
Changing rates: the area still works
Rates rarely stay constant. Suppose a cart's velocity grows steadily, meters per second. Over a tiny stretch of time the velocity is almost constant, so the cart moves almost (velocity) times (that tiny time): a thin rectangle under the graph. Put all the thin rectangles side by side and they fill the region under the graph. So the change in position is still the area under the velocity graph, even though the velocity keeps changing.
Worked example 1. A cart has velocity meters per second for . How far forward does it move?
The graph of is a line from to . The region under it is a triangle with base 6 seconds and height 18 meters per second.
Area . Units: (meters per second) times (seconds) = meters. The cart moves 54 meters forward.
Notice what would go wrong with "rate times time" using one rate: is far too big, because the cart only reaches 18 meters per second at the very end.
When a rate graph is made of line segments, the region splits into rectangles, triangles and trapezoids, and geometry gives the exact answer. When the graph curves, you will estimate the area in the next topic and find it exactly later in this unit.
Negative rates: area below the axis
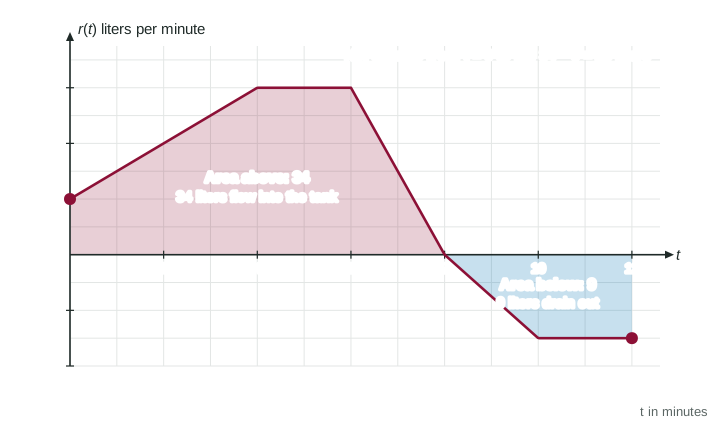
A rate can be negative: water draining out, a car backing up, a cooling oven. Then the graph lies below the horizontal axis. The region still has an area (a positive size), but it stands for a decrease. So:
- Area above the axis adds to the amount.
- Area below the axis subtracts from the amount.
- Net change = (area above) minus (area below).
Worked example 2. In the figure, water flows at rate liters per minute. The tank holds 50 liters at . How much does it hold at ?
Above the axis, from 0 to 8: a trapezoid from 0 to 4, ; a rectangle from 4 to 6, ; a triangle from 6 to 8, . That is 34 liters in.
Below the axis, from 8 to 12: a triangle from 8 to 10, , and a rectangle from 10 to 12, . That is 9 liters out.
Net change liters. Amount at 12 liters.
Starting amount plus change
The area tells you how much the amount changed, not how much there is. To know the amount at the end, you need where it started:
amount at the end = starting amount + net change
Forgetting the starting amount is one of the most common lost points on free-response questions. If a question says the tank held 50 liters at the start, that 50 belongs in your answer.
Reading the graph for behavior
You can also read when the amount grows. While the rate is positive the amount increases; while it is negative the amount decreases. So the amount is largest at a time where the rate changes from positive to negative. In the tank example the water is highest at minutes: before that, water was still coming in; after it, water drains. A smaller positive rate (from 6 to 8) still adds water. Only the sign of the rate decides whether the amount goes up.
How the exam asks it
- "What are the units of ...?" Multiply the rate's units by the input's units.
- "How much ... from to ?" Find the area, with regions below the axis subtracted.
- "How much is in the tank at ?" Starting amount plus net change.
- "When is the amount greatest?" Where the rate changes from positive to negative, or at an end of the interval: compare them.