Accumulating Change
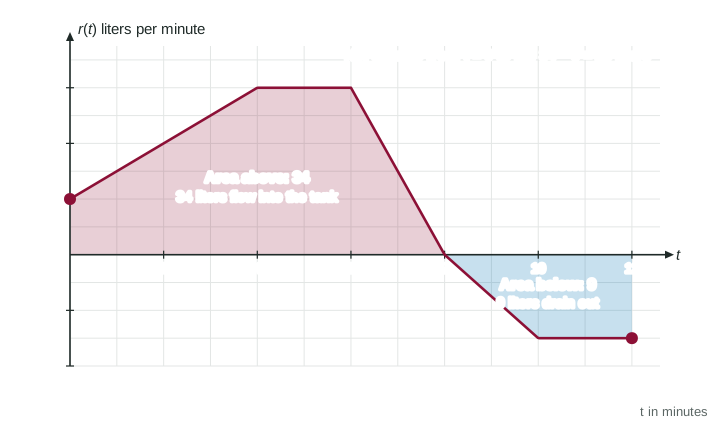
When you know a rate, the change in the amount is the area between the rate graph and the horizontal axis.
Part 1 · Hook
Why this matters
Part 2 · Before you start
What this builds on
Part 3 · Prerequisite check
Quick check before you start
1. Water flows into a tank at 12 liters per minute. What are the units of the rate of change of the rate, if it changes?
- liters per minute per minute
- liters per minute
- liters
- minutes per liter
Show the answer
A rate of a rate divides by time twice: liters per minute, per minute.
- Correct: liters per minute per minute:
- liters per minute:
- liters:
- minutes per liter:
2. A trapezoid has parallel sides of lengths 3 and 7 and a width of 4 between them. What is its area?
- 20
- 40
- 28
- 12
Show the answer
Average of the parallel sides times the width: .
- Correct: 20:
- 40:
- 28:
- 12:
3. A car's position is meters. What is ?
- its velocity, in meters per second
- its acceleration
- its distance from home
- its average speed over the trip
Show the answer
The derivative of position is velocity, the rate of change of position.
- Correct: its velocity, in meters per second:
- its acceleration:
- its distance from home:
- its average speed over the trip:
Part 4 · See it
See it first
Part 5 · Step by step
How it works, step by step
- A rate is constant over a stretch of timethe change in the amount is rate times time, the area of a rectangle under the rate graph
- The rate changes from moment to momentthe change is still the area under the rate graph, now a triangle, a trapezoid or a curved region
- The rate is negative over part of the timethat region lies below the axis and its area is subtracted: the amount decreases there
- You know the starting amount and the net changethe amount at the end is the starting amount plus the net change
Part 6 · Key ideas
Key ideas
- The area between a rate graph and the horizontal axis is the accumulated change in the amount.
- Units of the area = units of the rate times units of the input: (liters per minute) times (minutes) = liters.
- Area above the axis adds to the amount; area below the axis subtracts. The result is the net change.
- Amount at the end = starting amount + net change.
Part 7 · Misconception
A common mistake
The wrong idea: Area is always positive, so the area under a rate graph always means the amount went up.
What actually happens: A region below the axis comes from a negative rate: the amount goes down by that area. Add the areas above the axis and subtract the areas below to get the net change.
Part 8 · Check yourself
Check yourself
Exam-style questions. Anything you miss goes into your review queue.
Graph
The velocity of a toy train
1. By how many feet does the train's position change from to seconds?
No calculator. Type the exact value (a fraction, π, e or a root is fine), then its unit.
Show the answer
The change in position is the area under the velocity graph. Triangle from 0 to 2: . Rectangle from 2 to 6: . Total: feet.
- Answer: 20 feet
2. Find the net change in the train's position, in feet, from to seconds.
No calculator. Type the exact value (a fraction, π, e or a root is fine), then its unit.
Show the answer
Forward from 0 to 8: feet. Backward from 8 to 12: triangle plus rectangle , so 6 feet. Net change: feet.
- Answer: 18 feet
3. At what time in the interval from 0 to 12 seconds is the train farthest forward of where it started?
- , in the middle of the time at top speed
- , where turns from positive to negative
- , where the velocity starts to decrease
- , the right end of the time interval
Show the answer
The position grows while (from 0 to 8) and shrinks while (from 8 to 12). It is largest at .
- , in the middle of the time at top speed: The flat part is where the speed is largest, but the train keeps moving forward after t = 4, so its position keeps growing.
- Correct: , where turns from positive to negative: Correct: forward motion adds to the position until t = 8, and after that every second takes some back.
- , where the velocity starts to decrease: From 6 to 8 the velocity is smaller but still positive, so the train is still moving forward and its position still grows.
- , the right end of the time interval: After t = 8 the velocity is negative, so the train backs up: its position at 12 is 6 feet less than at 8.
4. Tank A fills at a constant 5 liters per minute. Tank B fills at a rate that grows steadily from 0 to 10 liters per minute over the same 4 minutes. Which tank gains more water in those 4 minutes?
- Tank A, because its rate is larger at the start
- It depends on how much water each tank held at first
- They gain the same amount, 20 liters each
- Tank B, because its rate reaches 10 liters per minute
Show the answer
A: liters. B: a triangle, liters. The amounts gained are equal.
- Tank A, because its rate is larger at the start: A leads early, but B catches up. Compare whole areas, not rates at one time.
- It depends on how much water each tank held at first: The question asks for the amount gained, which is the area under each rate graph, not the amount held.
- Correct: They gain the same amount, 20 liters each: Correct: a 4 by 5 rectangle and a triangle with base 4 and height 10 both have area 20.
- Tank B, because its rate reaches 10 liters per minute: B ends faster, but it starts at 0. Compare areas: B has a triangle of area 20, the same as the rectangle for A.
5. Water flows into or out of a tank at a rate liters per minute, positive when water enters. From to , the regions between the graph of and the t-axis have area 14 above the axis and 5 below. The tank held 30 liters at . How much does it hold at ?
- 9 liters
- 39 liters
- 49 liters
- 44 liters
Show the answer
Net change = area above minus area below liters. Amount at 10 = liters.
- 9 liters: That is the net change alone. Add it to the 30 liters already in the tank.
- Correct: 39 liters: Correct: 30 + 14 - 5.
- 49 liters: This adds the 5 liters, but the region below the axis is water leaving the tank.
- 44 liters: This ignores the 5 liters that drain out.
6. Oil leaks from a pipe at a rate that rises steadily from 2 liters per minute at to 8 liters per minute at minutes. How many liters leak in those 6 minutes?
No calculator. Type the exact value (a fraction, π, e or a root is fine), then its unit.
Show the answer
The rate graph is a line from to ; the region under it is a trapezoid with area liters.
- Answer: 30 liters
Part 9 · Summary
Summary
Part 10 · Up next
What comes next
Part 11 · Connections