The Normal Distribution
A density curve models a distribution with areas as probabilities.
Part 1 · Hook
Why this matters
Part 2 · Before you start
What this builds on
Part 3 · Prerequisite check
Quick check before you start
1. A value is 6 above the mean and the standard deviation is 4. What is its z-score?
- 1.5
- 6
- 0.67
- 24
Show the answer
standard deviations above the mean.
- Correct: 1.5:
- 6:
- 0.67:
- 24:
2. Which describes a distribution with a single peak and matching tails on both sides?
- Roughly symmetric
- Skewed right
- Skewed left
- Uniform
Show the answer
Matching tails on both sides mean symmetric.
- Correct: Roughly symmetric:
- Skewed right:
- Skewed left:
- Uniform:
Part 4 · See it
See it first
Part 5 · Step by step
How it works, step by step
- A distribution is roughly symmetric and bell-shapeda normal curve can model it, and areas under the curve are probabilities
- Every normal curve has the same shape in standard-deviation unitsabout 68%, 95% and 99.7% of values lie within 1, 2 and 3 SDs (the empirical rule)
- Standardize a value with any normal question becomes one about the standard normal , answered by Table A or technology
- Work backward from an areainverse normal gives the z, then gives the boundary
Part 6 · Key ideas
Key ideas
- A density curve is on or above the axis with total area 1; the area over an interval is the probability of that interval.
- A normal distribution is symmetric and bell-shaped, centered at with spread . The standard normal is .
- The empirical rule: about 68%, 95% and 99.7% within 1, 2 and 3 standard deviations of the mean.
- Show work: name the distribution and parameters, the boundary and the direction, for example ", ", with a sketch.
- Forward: , then the area. Backward: the area, then z, then .
Part 7 · Misconception
A common mistake
Part 8 · Check yourself
Check yourself
Exam-style questions. Anything you miss goes into your review queue.
Graph
Battery life of a phone model
1. What is the probability that a randomly chosen phone's battery lasts less than 16 hours?
- 0.9088
- 0.16
- 0.0912
- 0.025
Show the answer
B is .
- 0.9088: That is the area to the right of 16 hours, the complement.
- 0.16: That uses the empirical rule for 1 standard deviation, but 16 hours is 1.33 standard deviations below the mean.
- Correct: 0.0912: Right: the area to the left of z = −1.33.
- 0.025: That is the empirical rule for 2 standard deviations; 16 hours is less than 2 SDs away.
2. About what percent of phones have a battery life of more than 20.5 hours?
- About 95.2%
- About 16%
- About 2.5%
- About 4.8%
Show the answer
- About 95.2%: That is the area below 20.5 hours.
- About 16%: That is the empirical rule for 1 SD; 20.5 is 1.67 SDs above the mean.
- About 2.5%: That would be more than 2 SDs above the mean, 21 hours.
- Correct: About 4.8%: Right: the area to the right of z = 1.67.
3. What battery life is the 90th percentile?
- 19.92 hours
- 16.08 hours
- 19.35 hours
- 21.00 hours
Show the answer
The 90th percentile has 0.90 of the area below it: , so hours.
- Correct: 19.92 hours: Right: 1.28 standard deviations above the mean.
- 16.08 hours: That is the 10th percentile, 1.28 SDs below the mean.
- 19.35 hours: That uses z = 0.9 in place of the z-score with 0.90 of the area below it.
- 21.00 hours: That is 2 standard deviations above the mean, about the 97.7th percentile.
Graph
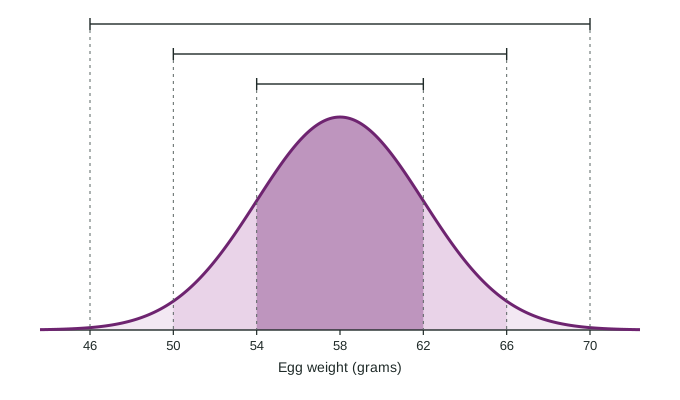
Egg weights at a farm
4. By the empirical rule, about what percent of eggs weigh between 54 and 62 grams?
- About 95%
- About 68%
- About 34%
- About 50%
Show the answer
54 and 62 are 1 standard deviation below and above the mean, , so about 68% of eggs fall between them.
- About 95%: That is within 2 standard deviations, 50 to 66 grams.
- Correct: About 68%: Right: within 1 standard deviation.
- About 34%: That is one side only, 58 to 62 grams.
- About 50%: Half of the eggs are below the mean, 58 grams.
5. By the empirical rule, about what percent of eggs weigh more than 66 grams?
- About 5%
- About 16%
- About 2.5%
- About 0.15%
Show the answer
66 is 2 standard deviations above the mean. About 95% lie within 2 SDs, leaving 5% in the two tails, so about 2.5% above 66 grams.
- About 5%: That is both tails together; above 66 is one tail.
- About 16%: That is above 1 SD, 62 grams.
- Correct: About 2.5%: Right: half of the 5% outside 2 SDs.
- About 0.15%: That is above 3 SDs, 70 grams.
6. What is the z-score of a 63-gram egg?
Type a number. A table answer and a calculator answer are both accepted.
Show the answer
- Answer: 1.25
Part 9 · Summary
Summary
Part 10 · Up next
What comes next
Part 11 · Connections