Correlation
The correlation r = 1/(n − 1) ∑ z_xz_y gives the direction (sign) and strength (closeness to ±1 ) of a linear association.
Part 1 · Hook
Why this matters
Part 2 · Before you start
What this builds on
Part 3 · Prerequisite check
Quick check before you start
1. A value is 1 standard deviation below the mean. What is its z-score?
Show the answer
A z-score counts standard deviations from the mean; below is negative.
- Correct: :
- :
- :
- :
2. Which word describes a scatterplot whose points fall from upper left to lower right?
- negative
- positive
- curved
- strong
Show the answer
One variable rises as the other falls: a negative direction.
- Correct: negative:
- positive:
- curved:
- strong:
Part 4 · See it
See it first
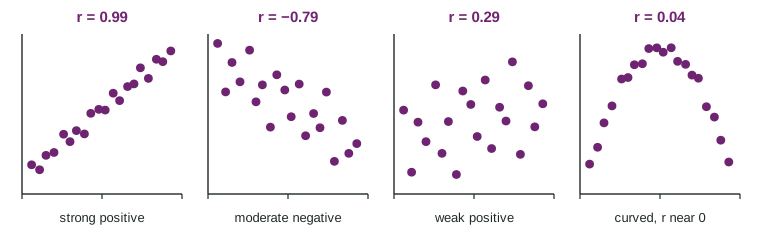
Part 5 · Step by step
How it works, step by step
- Standardize each value: and units disappear, so is the same in any units
- Points above average on both or below average on bothgive positive products ; mixed points give negative products
- Average the products: is positive for a rising pattern, negative for a falling one, and near when points hug a line
- measures only how well a straight line fitsalways plot first: a curve can have near 0, and one outlier can change a lot
Part 6 · Key ideas
Key ideas
- The correlation measures the direction and strength of a linear association; .
- Interpret: ": a strong, positive, linear association between hours studied and quiz score."
- has no units, does not change when units change, and is the same if and swap.
- is not resistant, measures only linear patterns, and never shows cause.
Part 7 · Misconception
A common mistake
The wrong idea: A correlation near 0 means the two variables are unrelated.
What actually happens: A correlation near 0 means there is no linear association. The variables can still be strongly related along a curve, so look at the scatterplot before trusting .
Part 8 · Check yourself
Check yourself
Exam-style questions. Anything you miss goes into your review queue.
Graph
Study time and quiz scores
1. Use technology to find the correlation between hours studied and quiz score. Give three decimal places.
Type a number. A table answer and a calculator answer are both accepted.
Show the answer
Technology (a linear regression or correlation command on the two lists) gives .
- Answer: 0.951
2. Which interpretation of is correct?
- The quiz scores are about 95% accurate measures
- About 95% of the students scored higher because they studied more
- A strong, positive, linear link between study time and score
- Each extra hour of study raises the score by 0.95 points
Show the answer
gives direction (sign) and strength (closeness to 1 or ) of a linear association.
- The quiz scores are about 95% accurate measures: Correlation measures a linear association, not accuracy.
- About 95% of the students scored higher because they studied more: is not a percent of students, and it says nothing about cause.
- Correct: A strong, positive, linear link between study time and score: Right: near 1 means a strong positive linear association.
- Each extra hour of study raises the score by 0.95 points: That would be a slope. has no units and does not measure change per hour.
3. The teacher recomputes with study time in minutes instead of hours. What happens to ?
- It becomes 60 times smaller, 0.016
- It stays 0.95
- It can no longer be computed
- It becomes 60 times larger, 57.0
Show the answer
is unitless: it does not change when either variable changes units.
- It becomes 60 times smaller, 0.016: Rescaling a variable does not change how tightly the points follow a line.
- Correct: It stays 0.95: Right: changing units changes every z-score not at all, so is unchanged.
- It can no longer be computed: Any units work; is based on standardized values.
- It becomes 60 times larger, 57.0: is always between and 1; it has no units to convert.
4. If quiz score were put on the horizontal axis and hours on the vertical axis, what would the correlation be?
- The negative,
- The same, 0.95
- The reciprocal, 1.05
- Zero, since a score is unable to explain hours
Show the answer
Correlation is symmetric in and .
- The negative, : Switching axes does not reverse the direction: high scores still go with more hours.
- Correct: The same, 0.95: Right: treats the two variables the same way, so switching them leaves it unchanged.
- The reciprocal, 1.05: A correlation can never exceed 1, and switching axes leaves it as it was.
- Zero, since a score is unable to explain hours: Correlation does not depend on which variable is called explanatory.
5. A ninth student studied 6 hours but scored 40. What would adding this student do to ?
- It would rise, since the new student studied a lot
- It would drop sharply, to about 0.14: is not resistant
- It would become negative, since 40 is the lowest score
- It would barely change, since one point out of nine is small
Show the answer
Like the mean and SD, is pulled by outliers.
- It would rise, since the new student studied a lot: The new point sits far below the trend, so the association gets weaker, not stronger.
- Correct: It would drop sharply, to about 0.14: is not resistant: Right: with the ninth point, technology gives . Correlation is not resistant to outliers.
- It would become negative, since 40 is the lowest score: It drops a lot, to about 0.14, but the other eight points still trend upward.
- It would barely change, since one point out of nine is small: One point far from the line can change a lot. Correlation is not resistant.
6. Which statement about the correlation is true?
- It is large for any strong curved pattern
- It is 1 whenever increases with
- It is between and 1 and has no units
- It is measured in the units of per unit of
Show the answer
, unitless, linear only.
- It is large for any strong curved pattern: A strong curve can give near 0.
- It is 1 whenever increases with : only when the points lie exactly on a rising line.
- Correct: It is between and 1 and has no units: Right: it is computed from z-scores, which have no units.
- It is measured in the units of per unit of : That describes a slope.
Part 9 · Summary
Summary
Part 10 · Up next
What comes next
Part 11 · Connections