Comparisons of the Distributions for One Quantitative Variable
To compare distributions, describe each feature (shape, center, spread, outliers) with a comparing word and numbers, in context.
Part 1 · Hook
Why this matters
Part 2 · Before you start
What this builds on
Part 3 · Prerequisite check
Quick check before you start
1. Which summary is the length of the box in a boxplot?
- The IQR
- The range
- The median
- The standard deviation
Show the answer
The box runs from to .
- Correct: The IQR:
- The range:
- The median:
- The standard deviation:
2. What does a standard deviation of 4 points tell you about test scores?
- Scores typically differ from the mean by about 4 points
- The mean is 4
- Four students were absent
- The highest score is 4 above the median
Show the answer
The standard deviation is a typical distance from the mean.
- Correct: Scores typically differ from the mean by about 4 points:
- The mean is 4:
- Four students were absent:
- The highest score is 4 above the median:
Part 4 · See it
See it first
Part 5 · Step by step
How it works, step by step
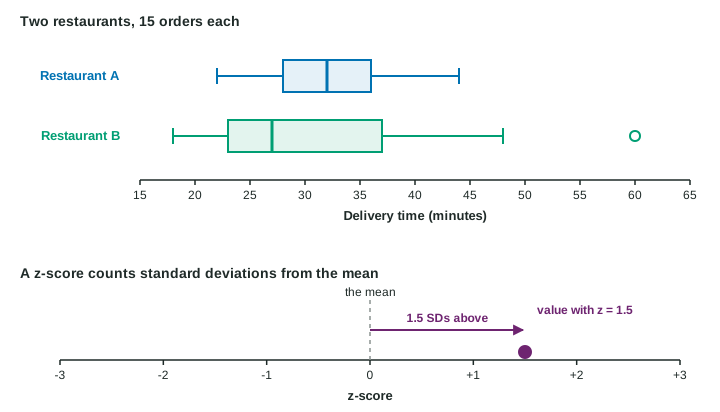
- Two groups are measured on the same variablegraph them on one scale, such as parallel boxplots or stacked dotplots
- Compare shape, center, spread and unusual featuresuse comparing words (greater, less variable) with numbers for each feature, in context
- Two values come from different distributionscompare their positions, not their raw sizes
- Subtract the mean and divide by the standard deviationthe z-score puts both on one scale: standard deviations above or below their own mean
Part 6 · Key ideas
Key ideas
- Compare distributions on every feature: shape, center, spread and outliers, each with a comparing word and numbers, in context.
- A z-score is (or for a population): how many standard deviations a value is above (+) or below (−) the mean. It has no units.
- Relative position compares values from different groups: z-scores and percentiles do this; raw values do not.
- The median of combined groups is not the average of their medians.
Part 7 · Misconception
A common mistake
The wrong idea: Route 1’s median is 31 minutes and Route 2’s median is 28 minutes. (Given as a comparison.)
What actually happens: That lists numbers but compares nothing. Say "Route 1 has a greater median travel time (31 minutes) than Route 2 (28 minutes)."
Part 8 · Check yourself
Check yourself
Exam-style questions. Anything you miss goes into your review queue.
Graph
Travel times on two bus routes
1. Which statement compares the centers of the two distributions?
- The median travel time for Route 1 is 31 minutes, and the median for Route 2 is 28 minutes
- Route 1 has a greater median travel time (31 minutes) than Route 2 (28 minutes)
- Route 2 has the greater center, as its trips run up to 62 minutes
- The routes have about the same center, as both are about 30 minutes
Show the answer
Compare with a comparing word and numbers: Route 1’s median (31) is greater than Route 2’s (28).
- The median travel time for Route 1 is 31 minutes, and the median for Route 2 is 28 minutes: Both numbers are right, but a comparison needs a comparing word: which median is greater?
- Correct: Route 1 has a greater median travel time (31 minutes) than Route 2 (28 minutes): Right: it names both medians and says which is greater, in context.
- Route 2 has the greater center, as its trips run up to 62 minutes: The longest trip is not the center. Route 2’s median, 28, is the smaller one.
- The routes have about the same center, as both are about 30 minutes: The medians differ by 3 minutes, and the comparison should say which is greater.
2. Which statement compares the variability of the two routes?
- Route 1’s times vary more, since its median of 31 minutes is the greater of the two medians
- The routes vary equally, since each has 15 timed trips
- Route 2’s times vary less, since its box starts at a lower time
- Route 2’s times vary more: its IQR is 15 minutes, against 6 for Route 1
Show the answer
Compare spreads with a measure such as the IQR: 15 minutes for Route 2 against 6 for Route 1, so Route 2 is more variable.
- Route 1’s times vary more, since its median of 31 minutes is the greater of the two medians: A larger center says nothing about spread.
- The routes vary equally, since each has 15 timed trips: Equal sample sizes do not mean equal spread.
- Route 2’s times vary less, since its box starts at a lower time: Where the box starts is position, not spread; Route 2’s box is wider.
- Correct: Route 2’s times vary more: its IQR is 15 minutes, against 6 for Route 1: Right: Route 2’s box is much wider, against .
3. Which comparison is the most complete?
- Route 2 is skewed right with an outlier at 62 minutes, while Route 1 is roughly symmetric with none; Route 1 has the greater median (31 against 28) but much less variability (IQR 6 against 15 minutes)
- Route 1’s median is 31 and its IQR is 6; Route 2’s median is 28 and its IQR is 15, and Route 2 also has an outlier at 62 minutes
- Route 2 is better, because some of its trips are much faster, and Route 1 is worse, because its trips are slower on most days
- Both routes have trips from about 20 to about 40 minutes, so the two distributions are nearly the same
Show the answer
A complete comparison covers shape, center, spread and unusual features, each with a comparing word and numbers, in context.
- Correct: Route 2 is skewed right with an outlier at 62 minutes, while Route 1 is roughly symmetric with none; Route 1 has the greater median (31 against 28) but much less variability (IQR 6 against 15 minutes): Right: shape, outliers, center and spread are all compared, with numbers and comparing words, in context.
- Route 1’s median is 31 and its IQR is 6; Route 2’s median is 28 and its IQR is 15, and Route 2 also has an outlier at 62 minutes: The numbers are right, but nothing is compared: which is greater, which varies more?
- Route 2 is better, because some of its trips are much faster, and Route 1 is worse, because its trips are slower on most days: "Better" and "worse" are judgments; the comparison needs shape, center and spread.
- Both routes have trips from about 20 to about 40 minutes, so the two distributions are nearly the same: This ignores the outlier, the different medians and the very different spreads.
4. The commuter must reach work within 40 minutes every day. Which route should she choose, based on these trips?
- Route 2: its median of 28 minutes is lower than Route 1’s
- Route 2: its fastest trip, 18 minutes, beats any Route 1 trip
- Route 1: all 15 of its trips took 39 minutes or less
- Either route
Show the answer
The claim is about the longest trips, so look at the upper end: Route 1 never went over 39 minutes; Route 2 went over 40 three times.
- Route 2: its median of 28 minutes is lower than Route 1’s: A lower typical time does not help if some trips are too long; 3 of Route 2’s trips took over 40 minutes.
- Route 2: its fastest trip, 18 minutes, beats any Route 1 trip: Her need is to never be late, which depends on the longest trips.
- Correct: Route 1: all 15 of its trips took 39 minutes or less: Right: Route 1’s maximum is 39. Route 2 took longer than 40 minutes on 3 of its 15 trips.
- Either route: Medians under 40 still allow trips over 40; Route 2 had three.
Table
Scores in two chemistry classes
| Class | Mean | Standard deviation |
|---|---|---|
| A | 74 | 8 |
| B | 81 | 4 |
5. Type the expression for the z-score of Ana’s score of 86 in class A.
Type the expression as on the exam, with the values substituted.
Show the answer
- Answer:
6. Type the expression for the z-score of Ben’s score of 88 in class B.
Type the expression as on the exam, with the values substituted.
Show the answer
.
- Answer:
7. Which student did better compared with their own class?
- Ana: her score is 12 points above her class mean, and Ben’s is 7
- Ben, because his score of 88 is higher than Ana’s 86
- Ben: his z-score of 1.75 is higher than Ana’s 1.5
- Neither
Show the answer
Standardize: Ana , Ben . Ben is further above his class in standard deviation units.
- Ana: her score is 12 points above her class mean, and Ben’s is 7: Raw distances ignore spread. Class B’s scores vary less, so 7 points there is a bigger achievement.
- Ben, because his score of 88 is higher than Ana’s 86: The classes took different tests, so raw scores cannot be compared.
- Correct: Ben: his z-score of 1.75 is higher than Ana’s 1.5: Right: Ben’s score is farther above his class mean, measured in standard deviations.
- Neither: z-scores are made exactly for this: they put both scores on the same scale.
8. Interpret Ana’s z-score of 1.5 in context.
Write the conclusion in context.
Show the answer
A z-score tells how many standard deviations a value is above (positive) or below (negative) the mean, in context.
- A full-credit answer: Ana’s score of 86 is 1.5 standard deviations above the mean score of class A.
Part 9 · Summary
Summary
Part 10 · Up next
What comes next
Part 11 · Connections