The Investigative Question Revisited and Data Collection
An investigative question names the population, the variable, the parameter and the kind of conclusion wanted.
Part 1 · Hook
Why this matters
Part 2 · Before you start
What this builds on
Part 3 · Prerequisite check
Quick check before you start
1. Which is a parameter?
- The proportion of all students at a school who walk to school
- The proportion of 50 sampled students who walk
- The number of students asked
- The answer of one student
Show the answer
A parameter describes the whole population.
- Correct: The proportion of all students at a school who walk to school:
- The proportion of 50 sampled students who walk:
- The number of students asked:
- The answer of one student:
2. Which question needs data from many individuals?
- How much do students at a school sleep on school nights?
- When does the school open?
- How many floors does the school have?
- What is the principal’s name?
Show the answer
Sleep varies from student to student.
- Correct: How much do students at a school sleep on school nights?:
- When does the school open?:
- How many floors does the school have?:
- What is the principal’s name?:
Part 4 · See it
See it first
Part 5 · Step by step
How it works, step by step
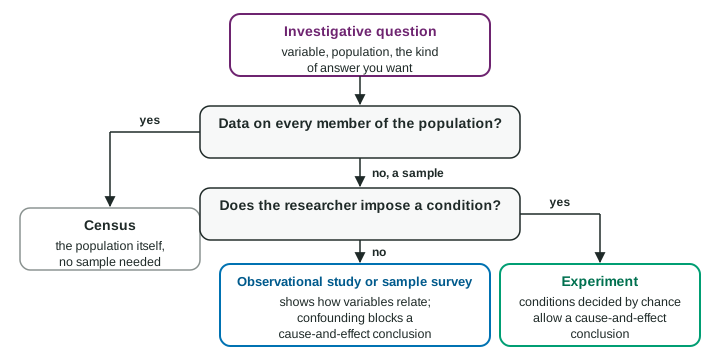
- Write an investigative question that names the population, the variable and the kind of answerit tells you what to measure, on whom, and which parameter you are after
- If you can measure the whole populationa census answers the question directly
- If you observe without imposing anything (a survey or observational study)you can describe the population and show how variables are related
- But groups that form on their own can differ in other waysconfounding blocks a cause-and-effect conclusion; that needs an experiment with conditions decided by chance
Part 6 · Key ideas
Key ideas
- An investigative question names the population, the variable, the parameter (such as a proportion or a typical value) and whether the goal is to describe or to look for a cause.
- A census collects data from every member of the population; a sample survey asks questions of a sample.
- An observational study records variables without imposing anything (looking back: retrospective; following forward: prospective). An experiment imposes conditions and measures the response.
- The explanatory variable may help explain changes in the response variable. A confounding variable is related to both, so its effect cannot be separated.
- A cause-and-effect conclusion needs an experiment in which chance decides who gets which condition.
Part 7 · Misconception
A common mistake
The wrong idea: Walkers in a study of 1,200 adults had lower blood pressure, so walking lowers blood pressure.
What actually happens: This is an observational study. Walkers may be younger or eat differently, and those confounding variables could explain the difference. Only an experiment supports cause and effect.
Part 8 · Check yourself
Check yourself
Exam-style questions. Anything you miss goes into your review queue.
Table
Walking and blood pressure
A health researcher studied the medical records of 1,200 adults in a city. Adults whose records said they walked 30 minutes or more a day had a lower typical blood pressure than adults who walked less. The researcher did not ask anyone to change how much they walk (invented data).
1. What kind of study is this?
- An experiment
- An observational study
- A census
- A sample survey, because the adults answered questions about walking
Show the answer
The researcher observed walking and blood pressure without imposing any condition, so this is an observational study.
- An experiment: Comparing groups is not enough for an experiment; the researcher would have to decide who walks.
- Correct: An observational study: Right: the researcher recorded walking and blood pressure as they already were, without imposing anything.
- A census: 1,200 adults are a part of the city, not every adult in it.
- A sample survey, because the adults answered questions about walking: No one was asked anything; the data came from existing records.
2. What are the explanatory and response variables?
- Explanatory: blood pressure. Response: daily walking time
- Explanatory: the city. Response: the adults
- Explanatory: medical records. Response: the researcher’s conclusion
- Explanatory: daily walking. Response: blood pressure
Show the answer
The explanatory variable is the one that may help explain changes in the response: walking explains blood pressure.
- Explanatory: blood pressure. Response: daily walking time: This reverses them. The researcher wants to see whether walking is related to blood pressure.
- Explanatory: the city. Response: the adults: The city and the adults are the setting and the observational units, not variables.
- Explanatory: medical records. Response: the researcher’s conclusion: Records are the data source, and a conclusion is not a variable.
- Correct: Explanatory: daily walking. Response: blood pressure: Right: the question is whether walking helps explain blood pressure.
3. Which is a possible confounding variable in this study?
- Age: younger adults may walk more and have lower blood pressure
- Blood pressure, since it is measured in each adult’s medical record
- The number of adults whose records were studied, 1,200
- Hair color, since it differs a lot from one adult to the next
Show the answer
A confounding variable is linked to both the explanatory and the response variable, so their effects cannot be separated. Age is a strong candidate.
- Correct: Age: younger adults may walk more and have lower blood pressure: Right: a confounding variable is related to both the explanatory and the response variable, so its effect mixes with walking’s.
- Blood pressure, since it is measured in each adult’s medical record: Blood pressure is the response variable itself.
- The number of adults whose records were studied, 1,200: The sample size is a fact about the study, not a variable recorded for each adult.
- Hair color, since it differs a lot from one adult to the next: A confounding variable must be related to both walking and blood pressure; hair color is linked to neither.
4. Can the researcher conclude that walking more lowers blood pressure?
- Yes: 1,200 adults is enough
- Yes: the walkers had lower blood pressure, so walking caused it
- No: it shows a link, and confounding may explain it
- No: blood pressure is too hard to measure accurately to tell either way
Show the answer
Only a study that imposes the conditions, with chance deciding who gets which, supports cause and effect. Here the link may be due to confounding.
- Yes: 1,200 adults is enough: A large observational study still cannot rule out confounding variables.
- Yes: the walkers had lower blood pressure, so walking caused it: A difference between groups that formed on their own can come from other differences between them.
- Correct: No: it shows a link, and confounding may explain it: Right: in an observational study the walkers may differ in other ways, such as age or diet, that affect blood pressure.
- No: blood pressure is too hard to measure accurately to tell either way: The measurement is fine; the problem is that walking was not imposed.
Table
Phones at lunch
The student council at Lincoln High School, which has 1,500 students, wants to learn about phone use during lunch. Members suggest four questions:
- Do you like your phone?
- What proportion of Lincoln High students use a phone during lunch on a typical school day?
- Do phones cause students to eat less at lunch?
- How many minutes did Maria spend on her phone at lunch today?
5. Which is the best investigative question?
- Question 1
- Question 3
- Question 2
- Question 4
Show the answer
A good investigative question names the population, the variable and the kind of answer (here a proportion), and can be answered with data that vary.
- Question 1: It is a survey item for one person, not a question about the population, and "like" is vague.
- Question 3: It asks about cause, which needs an experiment, and it does not name a population or a measurable variable.
- Correct: Question 2: Right: it names the population (Lincoln High students), the variable (phone use at lunch) and what to estimate (a proportion).
- Question 4: It has one answer about one student; there is no variation to study.
6. Researchers enroll 5,000 adults who do not smoke, record their diets, and follow them for 20 years to see who develops heart disease. What kind of study is this?
- A retrospective observational study of past heart disease
- A prospective observational study
- An experiment
- A census of the nation’s adults who do not smoke and who eat a recorded diet
Show the answer
Prospective: follow individuals forward and record outcomes. Retrospective: look back at existing records. Both are observational when nothing is imposed.
- A retrospective observational study of past heart disease: Retrospective studies look back at past records; this one looks forward.
- Correct: A prospective observational study: Right: it follows people forward in time, recording what happens, without imposing anything.
- An experiment: Length does not matter. No diet is imposed, so it is observational.
- A census of the nation’s adults who do not smoke and who eat a recorded diet: The 5,000 adults are a sample of nonsmokers.
7. Which of these is an investigative question that data from a sample could help answer? Select all that apply.
- What is the typical commute time of employees at a company of 900 workers?
- How long was my commute this morning?
- What time does the company office open each day?
- Is commuting bad?
Show the answer
An investigative question names a population and a variable whose values vary, and asks for something data can estimate.
- Correct: What is the typical commute time of employees at a company of 900 workers?: Right: it names a population and a variable that varies, and asks for a typical value.
- How long was my commute this morning?: One person, one answer: no variation to study.
- What time does the company office open each day?: A single fact to look up.
- Is commuting bad?: Too vague: no population, no measurable variable.
Part 9 · Summary
Summary
Part 10 · Up next
What comes next
Part 11 · Connections