
An exchange rate is a price, and like most prices it is set in a market. Banks, firms, travelers, savers and governments trade trillions of dollars' worth of currencies, one for another, and the price they settle on at any moment is the exchange rate. This market is the foreign exchange market, and on the exam you draw it as a supply and demand graph for one currency.
Who demands a currency, and who supplies it
Take the market for euros. Anyone who wants to buy something priced in euros has to get euros first, and anyone who holds euros and wants something priced in dollars has to sell them.
| In the market for euros | Who | Examples |
|---|---|---|
| Demand for euros | People outside Europe who want European goods, services or assets | A US store importing Italian shoes; a US tourist in Paris; a US pension fund buying German bonds |
| Supply of euros | Holders of euros who want goods, services or assets from outside Europe | A French firm importing US software; a Spanish student at a US college; a Dutch saver buying US stocks |
Notice that assets count as much as goods. Buying a German bond needs euros just as buying Italian shoes does.
Drawing the market
Put the quantity of euros on the horizontal axis and the price of the euro on the vertical axis. The price of a euro is measured in the other currency per euro: dollars per euro. Demand (D) slopes down and supply (S) slopes up, and where they cross is the equilibrium exchange rate (XR1) and the quantity of euros traded (Q1).
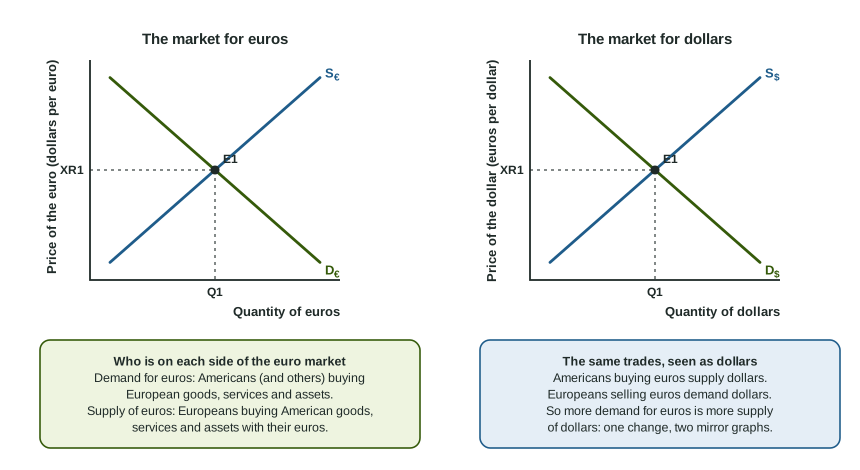
Why the slopes? When the euro is cheaper in dollars, everything priced in euros is cheaper for Americans, so they buy more European goods and assets and want more euros: demand slopes down. When the euro is dearer, each euro buys more dollars, so American goods are cheaper for Europeans, and they offer more euros to buy them: supply slopes up.
The market clears the way any market does. If the price of the euro is above equilibrium, more euros are offered than wanted (a surplus), and the price falls. Below equilibrium, a shortage pushes it up.
The axis is lost more than any other point on this graph. In the market for euros the vertical axis is the price of one euro, so euros go in the denominator: "dollars per euro". Writing "euros per dollar" on the euro market flips the ratio and costs the graph point. A quick test: the currency on the horizontal axis ("Quantity of euros") is the one after "per" on the vertical axis.
A change in demand or supply
A movement in the exchange rate itself moves you along the curves. Anything else that changes how much of a currency people want to buy or sell at each price shifts a curve. The next topic covers the main shifters in detail; here is the method on one example.
Show a change in tastes. Italian shoes become fashionable in the United States, so US stores order more of them. Show the effect on the market for euros.
- Draw and label: Quantity of euros across, Price of the euro (dollars per euro) up the side; D1 and S1 crossing at XR1 and Q1.
- Who needs to trade? US stores pay Italian firms in euros, so they must buy euros: this is the demand side.
- Shift: at every price, more euros are wanted, so demand shifts right from D1 to D2. Supply does not move.
- New equilibrium: D2 crosses S1 at a higher price, XR2, and a larger quantity, Q2.
- Say what it means: the price of the euro in dollars rose, so the euro appreciated.
Two markets, one change
Every euro bought with dollars is a dollar sold for euros. So the US stores in the example also show up in the market for dollars, drawn with Quantity of dollars across and Price of the dollar (euros per dollar) up the side. There they are sellers: the supply of dollars shifts right, and the dollar depreciates. That is the mirror image of the euro's appreciation, as it must be, since a euro that buys more dollars means a dollar that buys fewer euros.
When a question names one currency's market, draw that market. If it then asks about the other currency, translate with the mirror rule: more demand for one currency is more supply of the other.