The Foreign Exchange Market
The foreign exchange market is a supply and demand market for a currency.
Part 1 · Hook
Why this matters
Part 2 · Before you start
What this builds on
Part 3 · Prerequisite check
Quick check before you start
1. In any market, what happens when the price is above equilibrium?
- A surplus pushes the price down
- A shortage pushes the price up
- Demand shifts right
- Supply shifts left
Show the answer
Above equilibrium the quantity supplied is larger than the quantity demanded, so sellers lower the price.
- Correct: A surplus pushes the price down:
- A shortage pushes the price up:
- Demand shifts right:
- Supply shifts left:
2. The exchange rate is 1.25 dollars per euro. What is that the price of?
- One euro, in dollars
- One dollar, in euros
- A basket of European goods
- A European government bond
Show the answer
"Dollars per euro" is the number of dollars one euro costs: the price of the euro.
- Correct: One euro, in dollars:
- One dollar, in euros:
- A basket of European goods:
- A European government bond:
Part 4 · See it
See it first
Part 5 · Step by step
How it works, step by step
- Americans want more European goods, services or assetsthey need more euros, so the demand for euros shifts right
- Demand for euros rises with supply unchangedthe price of the euro in dollars rises: the euro appreciates
- Americans pay for those euros with dollarsthe supply of dollars shifts right in the market for dollars, so the dollar depreciates
Part 6 · Key ideas
Key ideas
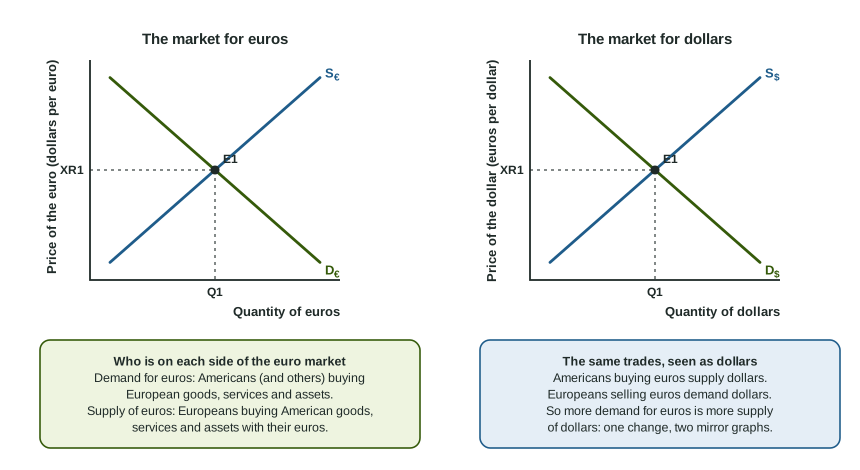
- In the foreign exchange market for a currency, the horizontal axis is the quantity of that currency and the vertical axis is its price in the other currency per unit: dollars per euro in the market for euros.
- Demand for a currency comes from people abroad who want the country's goods, services and assets. Supply comes from the currency's own holders who want foreign goods, services and assets.
- Demand slopes down: a cheaper euro makes European goods cheaper for Americans, so they want more euros. Supply slopes up: a dearer euro makes American goods cheaper for Europeans, so they offer more euros.
- One set of trades shows in both markets as mirror changes: more demand for euros is more supply of dollars.
Part 7 · Misconception
A common mistake
The wrong idea: In the market for euros, the vertical axis is the number of euros per dollar.
What actually happens: In the market for euros, the vertical axis is the price of one euro: dollars per euro. The currency being traded is the one in the denominator of the price.
Part 8 · Check yourself
Check yourself
Exam-style questions. Anything you miss goes into your review queue.
Graph
The market for arls (Arland's currency), traded for bels (Belvia's currency)
1. What does the vertical axis of this graph measure?
- The price of the bel, in arls per bel
- The price of the arl, in bels per arl
- The interest rate on Arland bonds
- The price level in Arland
Show the answer
Market for arls: price of the arl, in bels per arl.
- The price of the bel, in arls per bel: That is the flipped ratio. In the market for arls, the price is of one arl, in bels.
- Correct: The price of the arl, in bels per arl: Right: in the market for a currency, the vertical axis is its price in the other currency per unit of it.
- The interest rate on Arland bonds: Interest rates go on the money market and loanable funds graphs, not here.
- The price level in Arland: The price level goes on the AD-AS graph; this graph prices a currency.
2. Who is on the demand side of this market?
- Arland residents who want to buy Belvian goods
- Belvian firms that sell their goods inside Belvia
- Belvians who want Arland goods, services or assets
- Arland households saving more in Arland banks
Show the answer
Demand for a currency comes from people abroad who want to buy the country's goods, services and assets.
- Arland residents who want to buy Belvian goods: They pay with arls to get bels, so they supply arls.
- Belvian firms that sell their goods inside Belvia: A sale inside Belvia is paid in bels and needs no arls.
- Correct: Belvians who want Arland goods, services or assets: Right: to pay for anything from Arland, Belvians need arls, so they demand arls (and supply bels).
- Arland households saving more in Arland banks: Saving at home in arls involves no trade of arls for bels.
3. Who is on the supply side of this market?
- Arland residents who want Belvian goods, services or assets
- Belvian tourists planning trips to Arland
- Arland exporters paid in bels by Belvian buyers
- Belvian savers buying Arland government bonds
Show the answer
Supply of a currency comes from its own holders who want to buy foreign goods, services and assets.
- Correct: Arland residents who want Belvian goods, services or assets: Right: they sell arls to get the bels they need, so they supply arls.
- Belvian tourists planning trips to Arland: Tourists from Belvia buy arls to spend in Arland, so they demand arls.
- Arland exporters paid in bels by Belvian buyers: They trade the bels they earn for arls, so they add to the demand for arls.
- Belvian savers buying Arland government bonds: Buying an Arland asset needs arls, so these savers demand arls.
4. Suppose the price of the arl were above its equilibrium on this graph. What would happen, and why?
- A shortage of arls would push the price of the arl up further
- The demand for arls would shift right until it met the price
- A surplus of arls would push the price of the arl down
- The supply of arls would shift left until it met the price
Show the answer
Above equilibrium, a surplus of the currency pushes its price down toward equilibrium.
- A shortage of arls would push the price of the arl up further: Above equilibrium, the quantity supplied is larger than the quantity demanded: a surplus, not a shortage.
- The demand for arls would shift right until it met the price: A price away from equilibrium causes a movement along the curves, not a shift.
- Correct: A surplus of arls would push the price of the arl down: Right: at a price above equilibrium, more arls are offered than wanted, and sellers accept fewer bels per arl until the market clears.
- The supply of arls would shift left until it met the price: The curves stay put; the price adjusts along them to the crossing.
5. Label the axes and the curves of the market for arls, the currency of Arland, traded for bels.
Work on the graph (it needs JavaScript), then check.
Show the answer
The horizontal axis is the quantity of arls. The vertical axis is the price of the arl in the other currency per arl: bels per arl. Demand slopes down, supply slopes up.
- Key: see the explanation
6. Tourists from Belvia start visiting Arland in much larger numbers. In the market for arls, shift the right curve and mark the new equilibrium.
Work on the graph (it needs JavaScript), then check.
Show the answer
Belvian tourists need arls to spend in Arland, so the demand for arls shifts right. The price of the arl in bels rises (it appreciates) and the quantity of arls traded rises.
- Key: demand shifts right
Part 9 · Summary
Summary
Part 10 · Up next
What comes next
Part 11 · Connections