The definition of the derivative needs a formula: you substitute , simplify and take a limit. Real data rarely comes with a formula. A thermometer gives readings every few minutes; a graph gives a picture. This page shows how to estimate from a table, from a graph and with a calculator, and how to say what the estimate means.
From a table: a difference quotient you can compute
The derivative is the limit of difference quotients as the interval shrinks. With a table, you cannot shrink the interval past the data, so you stop at the best interval the table offers and use that quotient as the estimate.
To estimate from a table:
- Pick two inputs on either side of , as close to as the table allows: . If itself is in the table, the closest inputs just before and just after it are a good choice.
- Compute , subtracting in the same order on top and bottom.
- Attach units: output units per input unit.
The interval must contain . A quotient from data far away describes a different stretch of the function. At the first or last entry of a table there is only one side, so use the closest one-sided quotient.
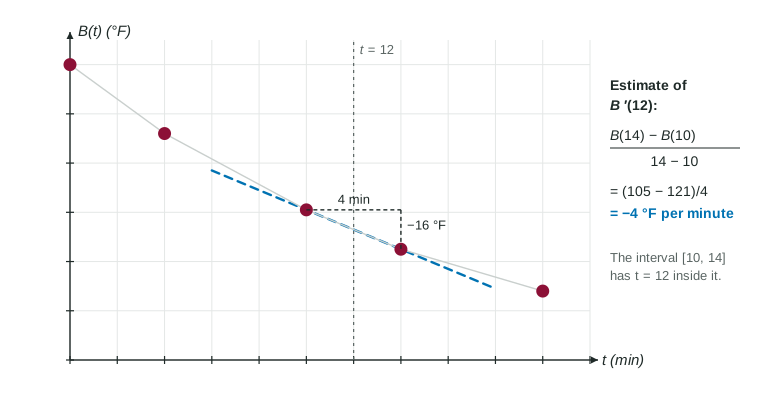
Worked example 1. A loaf of bread cools on a rack. Its temperature , in degrees Fahrenheit, is recorded at minutes.
| (minutes) | 0 | 4 | 10 | 14 | 20 |
|---|---|---|---|---|---|
| (degrees Fahrenheit) | 180 | 152 | 121 | 105 | 88 |
Estimate and interpret it.
Inputs on either side of 12: and .
Quotient:
Meaning: at minutes, the bread's temperature is decreasing at about 4 degrees Fahrenheit per minute.
Notice what the answer is: a rate, with "per minute" in its units. A frequent slip is to give a temperature instead, such as averaging and to get 113. That estimates , the value, not , the rate.
Notice, too, how the sentence is built. It names the time (), the quantity (the bread's temperature), the direction (decreasing, from the negative sign) and the units. A sentence that says only "the slope is " leaves out everything a reader needs.
Uneven spacing is fine
Tables on the exam often have unequal gaps. Use the actual widths. With data at and , the width is 3, whatever the other gaps are. In Worked example 1, the intervals are 4, 6, 4 and 6 minutes wide; each quotient divides by its own width.
The symmetric difference quotient
If you know at and , the quotient across the point,
is the symmetric difference quotient. Its denominator is the full width . It equals the average of the left quotient and the right quotient , and their errors partly cancel, so it is usually much closer to than either one.
Worked example 2. A function has , and . Estimate .
Left:
Symmetric:
From a graph
When you have a graph, the derivative at is the slope of the tangent line at . If the tangent line is drawn, read two points on it where it crosses grid lines and compute rise over run. If it is not drawn, lay a ruler along the curve so that it just touches at the point, then read two points on the ruler. Choose points far apart on the line: small reading errors matter less over a long run.
A graph also tells you the sign of at a glance: positive where the graph rises, negative where it falls, zero where its tangent line is level.
With a calculator
A graphing calculator has a numerical derivative command. Give it the function and the input, and it returns a decimal estimate of , computed from a symmetric difference quotient with a very small . On calculator questions:
- Write the setup, such as , then the value. A bare number earns little.
- Give three decimal places: . Store intermediate values instead of rounding them.
- Use radian mode whenever a trigonometric function appears.
Which estimate to trust
| Method | Uses | When |
|---|---|---|
| Quotient across from a table | the closest data on each side | data only; the usual exam method |
| One-sided quotient | and its nearest neighbor | is the first or last entry |
| Tangent line on a graph | two points on the line | a graph with the line drawn |
| Numerical derivative | the calculator | a formula on a calculator question |
Every one of these is an approximation of a limit. The exam asks for the estimate, its setup and its units; it does not expect the exact value. The next topic asks when a derivative exists at all.