Estimators
A statistic used to estimate a parameter is an estimator, and its value from one sample is a point estimate.
Part 1 · Hook
Why this matters
Part 2 · Before you start
What this builds on
Part 3 · Prerequisite check
Quick check before you start
1. A survey finds that 62% of 500 randomly chosen adults in a state own a pet. In this sentence, 62% is
- a statistic, because it describes the sample
- a parameter, because it describes the state
- a parameter, because the sample was random
- a statistic, because it is a percent
Show the answer
A statistic describes a sample; a parameter describes the whole population. The 62% comes from the 500 adults surveyed.
- Correct: a statistic, because it describes the sample:
- a parameter, because it describes the state:
- a parameter, because the sample was random:
- a statistic, because it is a percent:
2. A computer takes 1,000 random samples of the same size from one population and records the sample proportion from each. The distribution of those 1,000 values approximates
- the sampling distribution of the sample proportion
- the distribution of the population
- the distribution of one sample
- the probability that one sample is correct
Show the answer
The values of a statistic over many samples of the same size form (approximately) its sampling distribution.
- Correct: the sampling distribution of the sample proportion:
- the distribution of the population:
- the distribution of one sample:
- the probability that one sample is correct:
3. Asking students in the school gym whether they play a sport is likely to give a result that is
- too high, because students in the gym are more likely to play
- too low, because the gym is a small place
- about right, because many students use the gym
- random, because nobody chose the students
Show the answer
A convenience sample like this favors students who play sports, so it is biased upward.
- Correct: too high, because students in the gym are more likely to play:
- too low, because the gym is a small place:
- about right, because many students use the gym:
- random, because nobody chose the students:
Part 4 · See it
See it first
Part 5 · Step by step
How it works, step by step
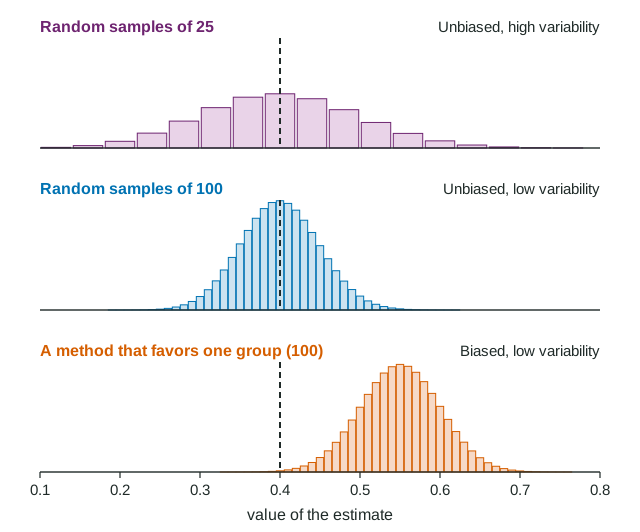
- A sample is only part of the populationa statistic such as is used as an estimator of the parameter, and its value is a point estimate
- Different samples give different values of the statisticthe statistic has a sampling distribution, with a center and a spread
- The center of that sampling distribution equals the parameterthe estimator is unbiased: it is right on average, though single samples still miss
- The random sample is made largerthe spread of the sampling distribution shrinks, so a typical estimate lands closer to the parameter
- The method favors some members of the populationthe center moves away from the parameter, and a bigger sample of the same kind does not move it back
Part 6 · Key ideas
Key ideas
- An estimator is a statistic used to estimate a parameter: for , for . One sample's value is a point estimate.
- Bias is about the center: an unbiased estimator has a sampling distribution centered at the parameter.
- Variability is about the spread of the sampling distribution. For random samples, larger samples give less variability.
- Bias comes from the method, so a larger sample does not fix it. Variability comes from sample size, so a better method alone does not fix it.
- The best estimator has no bias and low variability: random selection plus a large enough sample.
Part 7 · Misconception
A common mistake
The wrong idea: An unbiased estimator gives the right answer, so if a random sample says 0.31, the population proportion is 0.31.
What actually happens: Unbiased means right on average over many samples. One random sample's estimate still misses the parameter by some amount; how far it tends to miss is the variability.
Part 8 · Check yourself
Check yourself
Exam-style questions. Anything you miss goes into your review queue.
Table
Four ways to estimate the proportion of faulty phone chargers
A shipment holds 40,000 phone chargers, and 8% of them are faulty, so . An inspector simulates each of four sampling methods 1,000 times. Each time, the method gives one sample proportion of faulty chargers. The table summarizes the 1,000 sample proportions from each method.
| Method | How the chargers are chosen | Mean of the 1,000 sample proportions | Standard deviation of the 1,000 sample proportions |
|---|---|---|---|
| W | Simple random sample of 50 chargers | 0.080 | 0.038 |
| X | Simple random sample of 200 chargers | 0.080 | 0.019 |
| Y | The first 200 chargers packed on one morning shift | 0.052 | 0.016 |
| Z | 50 chargers the inspector picks by hand from open boxes | 0.110 | 0.044 |
1. Which methods appear to give unbiased estimators of ? Select all that apply.
- Method W
- Method X
- Method Y
- Method Z
Show the answer
An estimator is unbiased when the center of its sampling distribution equals the parameter. Methods W and X have means of 0.080, which is .
- Correct: Method W: Right: its 1,000 estimates center at 0.080, the true value of .
- Correct: Method X: Right: its 1,000 estimates also center at 0.080.
- Method Y: Its estimates center at 0.052, well below 0.08, so it underestimates : biased.
- Method Z: Its estimates center at 0.110, above 0.08, so it overestimates : biased.
2. Which method gives estimates that vary the least from one sample to the next?
- Method X, because it is unbiased and uses 200 chargers
- Method Y, with a standard deviation of 0.016
- Method W, because its mean equals the true proportion
- Method Z, because its mean of 0.110 is the largest
Show the answer
Variability is the spread of the sampling distribution, measured here by the standard deviation of the 1,000 estimates. Method Y has the smallest, 0.016, even though it is biased.
- Method X, because it is unbiased and uses 200 chargers: X is the best method overall, but Y has a slightly smaller standard deviation (0.016 against 0.019). Low variability and no bias are separate properties.
- Correct: Method Y, with a standard deviation of 0.016: Right: the smallest spread of the four, so Y varies least, even though it misses .
- Method W, because its mean equals the true proportion: A mean equal to says W is unbiased. It says nothing about spread, and W's spread, 0.038, is large.
- Method Z, because its mean of 0.110 is the largest: The mean tells you where the estimates center, not how much they vary. Z has the largest spread.
3. The inspector can afford to check 200 chargers. Which method should the inspector use, and why?
- Method Y, because its estimates have the smallest spread
- Method X: its estimates center at with little spread
- Method Z, because a person checks each box before choosing
- Method W, because a smaller sample has less chance of error
Show the answer
A good estimator has no bias and low variability. Method X centers on and has a small spread; Method Y has a slightly smaller spread but misses by about 0.03 on average.
- Method Y, because its estimates have the smallest spread: Precision does not help when the estimates are centered in the wrong place: Y's estimates cluster around 0.052, not 0.08.
- Correct: Method X: its estimates center at with little spread: Right: no bias and low variability together.
- Method Z, because a person checks each box before choosing: Choosing by hand is not random; Z centers at 0.110 and has the largest spread.
- Method W, because a smaller sample has less chance of error: A smaller random sample gives more variable estimates: W's standard deviation is twice X's.
4. A website poll asks visitors whether a new stadium should be built, and 1,200 visitors respond. A second poll with the same method gets 12,000 responses. What does the larger poll improve?
- Both its bias and its variability
- Its bias, but not its variability
- Its variability, but not its bias
- Neither, because website polls give no information
Show the answer
A larger sample reduces variability, so the second poll's result would vary less from poll to poll. Voluntary response bias comes from who chooses to answer, and a bigger sample of the same kind of people keeps that bias.
- Both its bias and its variability: Bias comes from the method (people choose to respond). More responses of the same kind do not remove it.
- Its bias, but not its variability: It is the other way round: sample size works on variability, and method works on bias.
- Correct: Its variability, but not its bias: Right: more responses means less sample to sample variation, but the same voluntary response bias.
- Neither, because website polls give no information: The larger poll does reduce variability; it still estimates the wrong thing because of bias.
5. An archer's arrows land in a tight group well to the left of the bullseye. If the bullseye is the parameter and each arrow is an estimate from one sample, the archer is like an estimator with
- high bias and high variability
- no bias and low variability
- no bias and high variability
- high bias and low variability
Show the answer
Tight grouping means low variability; a group centered away from the bullseye means bias.
- high bias and high variability: The arrows are close together, so variability is low.
- no bias and low variability: The group is centered to the left of the bullseye, so the estimator is biased.
- no bias and high variability: This would be arrows scattered widely around the bullseye.
- Correct: high bias and low variability: Right: consistent, but consistently off target.
6. A store manager wants the mean time customers wait in line. Each day for 100 days he times 25 randomly chosen customers and records their mean. The mean of his 100 sample means is very close to the true mean wait. This shows that the sample mean is
- an unbiased estimator of the mean wait for all customers
- equal to the true mean wait on each of the 100 days
- a biased estimator, because the wait times vary from day to day
- an estimator with no variability once 100 days are averaged
Show the answer
When the center of the distribution of a statistic matches the parameter, the statistic is an unbiased estimator. Each single sample mean still differs from the true mean.
- Correct: an unbiased estimator of the mean wait for all customers: Right: its sampling distribution is centered at the parameter.
- equal to the true mean wait on each of the 100 days: Single sample means vary from day to day; only their center matches the true mean.
- a biased estimator, because the wait times vary from day to day: Variation from sample to sample is variability, not bias.
- an estimator with no variability once 100 days are averaged: Averaging the 100 sample means shows where they center; each day's mean still varies.
Part 9 · Summary
Summary
Part 10 · Up next
What comes next
Part 11 · Connections