
A new ramen shop opens and has a line out the door for months. Then three more ramen shops open within a few blocks, each with its own broth and its own look. A year later the first shop is still busy, but its owner earns only what she could earn running someone else's restaurant. Many sellers, products that are similar but not identical, and easy entry: that is monopolistic competition, the market structure of restaurants, salons, clothing brands and gyms.
Part monopoly, part competition
Each firm sells a differentiated product: a different location, style, quality or brand. Some buyers prefer it, so the firm can raise its price a little without losing every customer. Like a monopolist, it faces a downward-sloping demand curve with MR below it, produces where MR = MC and reads its price from demand. But it has many close rivals, so its demand is quite elastic, and entry and exit are easy, like perfect competition. That last feature decides the long run.
| Perfect competition | Monopolistic competition | Monopoly | |
|---|---|---|---|
| Firm's demand | horizontal: d = MR = AR = P | downward sloping, fairly elastic | the market demand curve |
| Entry | easy | easy | blocked |
| Long-run economic profit | zero | zero | can be positive |
| Long-run price | P = MC = minimum ATC | P = ATC, above MC | above MC and ATC |
| Allocatively efficient (P = MC)? | yes | no | no |
| At minimum ATC? | yes | no: excess capacity | not in general |
The short run
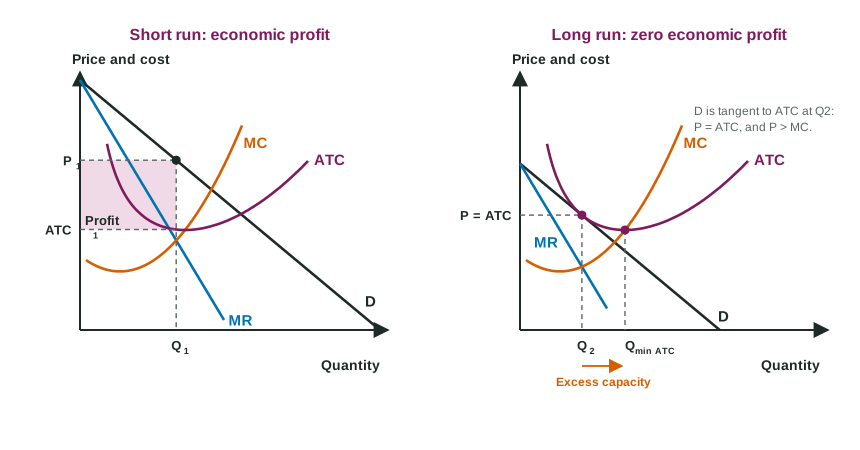
In the short run the graph is exactly the monopoly graph: D, MR below it, MC through the minimum of ATC. Find Q1 where MR = MC, go up to demand for P1, and compare P1 with ATC at Q1. If P1 is above ATC, the firm earns the profit rectangle ; if below, the same rectangle is a loss.
The long run: entry, exit and the tangency
Economic profit is a signal: owners elsewhere could earn more here. Because entry is easy, new firms with similar products open. Each one takes some of the existing firms' buyers, so each firm's demand curve shifts left (MR moves with it) and becomes more elastic, since buyers now have more substitutes. Entry continues until demand just touches ATC: the tangency. There, P = ATC and economic profit is zero, so entry stops.
Slip to avoid: "firms enter because demand rises." Firms enter because of economic profit, and entry lowers each existing firm's demand.
Losses work in reverse: some firms exit, their customers move to the firms that remain, and each remaining firm's demand shifts right until it is tangent to ATC again.
Worked example: reading a long-run equilibrium. Maple Row Sandwiches (invented) sells 40 sandwiches an hour at $8.00. At 40 sandwiches its ATC is $8.00 and its MC is $5.00. Its ATC would be lowest, $6.50, at 60 sandwiches.
- Profit. : zero economic profit, so this is a long-run equilibrium. Use ATC at the quantity sold, not MC and not minimum ATC.
- Allocative efficiency. P ($8) is above MC ($5): buyers value one more sandwich at $8 and it costs $5, so too few are made.
- Excess capacity. sandwiches an hour: the shop is smaller than the size with the lowest ATC, so it is not productively efficient either.
Excess capacity and variety
Why does the tangency fall short of minimum ATC? A downward-sloping line can just touch a U-shaped curve only where the curve is also falling, to the left of its minimum. So in the long run each firm produces less than the output at minimum ATC: excess capacity. Prices are a little higher than in perfect competition. In return, buyers get variety: many kinds of sandwiches, salons and gyms instead of one standard product. Economists treat that as a trade-off, not a clear loss.
Advertising and brands
Firms in monopolistic competition spend on advertising and brand building to make their product seem more different. If it works, demand shifts right and becomes less elastic, so the firm can charge more. But advertising raises ATC, and rivals can copy a good idea, so in the long run entry still pushes economic profit toward zero.
For the exam
- Draw the long-run graph with D tangent to ATC at the quantity where MR = MC, MC through the minimum of ATC, and the tangency to the left of that minimum.
- Write the long-run chain with every link: profit, entry, each firm's demand shifts left, tangency, zero profit.
- Name both inefficiencies: P > MC and output below minimum ATC (excess capacity).