
A candle maker pays the same rent whether she pours ten candles or a thousand, but every extra candle needs more wax and more of her assistant's paid hours. Sorting costs into those two kinds, then dividing by output, gives the four cost curves under every firm graph in this course.
Fixed costs and variable costs
In the short run, a firm has at least one fixed input, so some of its costs are fixed:
- Total fixed cost (TFC) does not change with output: rent on a lease, insurance, a yearly license fee. It is paid even when the firm produces nothing, so TFC is the total cost at zero output.
- Total variable cost (TVC) rises with output: materials, energy for the machines, hourly labor. At zero output it is zero.
- Total cost (TC) is the sum: TC = TFC + TVC.
Average costs
Dividing each total by the quantity of output, Q, gives a cost per unit:
- Average fixed cost: AFC = TFC / Q. It falls as output grows, because the same fixed cost is spread over more units.
- Average variable cost: AVC = TVC / Q.
- Average total cost: ATC = TC / Q, which also equals AFC + AVC. So the vertical gap between the ATC and AVC curves is AFC, and it shrinks as output grows.
Marginal cost
Marginal cost is the cost of one more unit: . Because fixed cost does not change, the change in total cost equals the change in variable cost, so MC can be found from either column.
Worked example: a cost table that counts by tens. A firm's total cost is $100 at 0 units, $180 at 10, $240 at 20, $290 at 30, $360 at 40 and $450 at 50.
- Fixed cost. TC at zero output: TFC = $100. Variable cost at 40 units is dollars.
- Marginal cost, 30 to 40 units.
dollars a unit. The slip is to stop at 70: output rose by 10 units, so divide by 10. - Averages at 40 units. AFC = , AVC = , ATC = , and dollars.
- Compare. MC from 40 to 50 units is , equal to ATC: that is where ATC is at its lowest.
Some tables put output in the second column or count workers instead of units. Always find which column is output before you divide.
The shapes of the curves
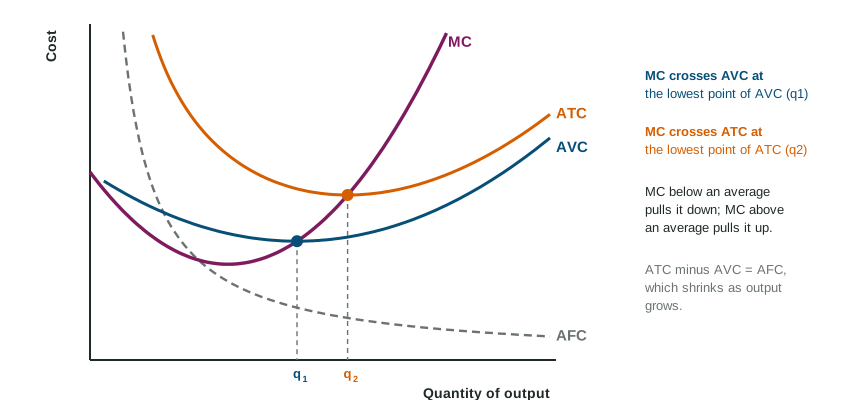
Marginal cost often falls at first, because workers specialize and each one adds more output than the one before. Then diminishing marginal returns set in: each extra worker adds less, so each extra unit takes more paid hours, and MC rises. That link from Topic 3.1 is why MC slopes up.
Now think about your test average again. When the next unit costs less than the average, it pulls the average down; when it costs more, it pulls the average up. So MC crosses AVC and ATC at their lowest points. Readers check this on every graph: draw one clear bottom on each U and run MC through it. The lowest point of AVC comes at a smaller output than the lowest point of ATC, because ATC also includes AFC, which keeps falling.
What shifts the cost curves
| Change | Kind of cost | MC | AVC | ATC | AFC |
|---|---|---|---|---|---|
| Higher rent or a lump-sum tax | fixed | no change | no change | up | up |
| Higher wage for hourly workers, dearer materials | variable | up | up | up | no change |
| A per-unit tax on each unit produced | variable | up | up | up | no change |
| Better technology or more productive workers | variable | down | down | down | no change |
The key test: does the change raise the cost of making one more unit? A fee paid once, whatever the output, does not, so MC stays put and only ATC rises. A cost paid on every unit does, so MC rises and the averages rise with it.