
Marlow Street Bakery sells more croissants on Monday than it did last week, because it cut the price from $4 to $3. On Tuesday it sells more again, at the same $3, because a large office opened next door. Both days end with more croissants sold, but on a graph they look different. On Monday customers moved along the curve; on Tuesday the whole curve moved. Mixing these two up is one of the most common ways to lose a graph point, and the test that separates them takes one question.
Every curve holds other things equal
A curve on a market graph shows how the quantity relates to the price, and nothing else. Buyers' incomes, their tastes, the prices of other goods, the number of buyers, the sellers' costs: all of these matter, but the curve holds them fixed while it shows price and quantity. Economists call this ceteris paribus, Latin for "other things equal". It is the rule behind every curve you will draw.
The rule gives a simple test. If the thing that changed is one of the two variables on the axes, you stay on the curve. If it is one of the "other things", the curve itself has to move.
Movement along a curve
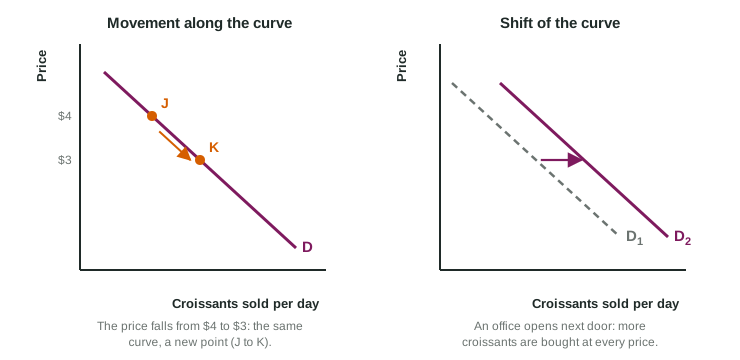
When the good's own price changes, and only the price, buyers slide along the same curve to a new point. In the left panel of the figure, the price falls from $4 to $3 and buyers move from J down to K: a lower price, a larger quantity, the same curve D. Nothing about the curve changed; you read a different point on it. The same holds for the sellers' curve S: a higher price moves sellers up along S to a larger quantity offered.
Shift of a curve
When one of the other things changes, every point on the curve moves. In the right panel, the office brings new customers who want croissants at every price, so the whole curve moves right from D1 to D2. A shift right means a larger quantity at every price; a shift left means a smaller quantity at every price. Use the words right and left: "up" and "down" are ambiguous for a curve that slopes.
| Movement along a curve | Shift of a curve | |
|---|---|---|
| Caused by | a change in a variable on one of the axes (on a market graph, the good's own price) | a change in anything else (incomes, tastes, costs, the number of buyers or sellers) |
| On the graph | a new point on the same curve | a new curve, labeled with a new subscript (D1 to D2) |
| Words to use | "moves up along", "moves down along" | "shifts right", "shifts left" |
Worked example: the bakery's week. Decide what each event does to the bakery's graph.
- Monday: the price of a croissant falls from $4 to $3. Price is on the vertical axis, so buyers move down along D to a larger quantity. No curve shifts.
- Tuesday: an office opens next door. More customers want croissants at every price. That is not on either axis, so D shifts right.
- Thursday: the butter the bakery buys doubles in price. A higher cost means the bakery offers fewer croissants at every price, so S shifts left.
- Friday: a cafe across the street sells croissants for $2. Some customers switch, so fewer Marlow Street croissants are wanted at every price: D shifts left. Marlow Street's own price did not change.
The method: name what changed, check whether it is on an axis, then decide. Never start from "they sold more, so the curve shifted right": selling more can come from either one.
Drawing a shift so it scores
A shift earns its point only when a reader can see which curve moved and which way. Keep the original curve and label it with subscript 1 (D1 or S1). Draw the new curve on the correct side and label it with subscript 2. Add an arrow from the old curve to the new one. Never erase the old curve: the reader compares the two.
Which curve moves depends on whose behavior changed. A change that affects what buyers want at each price (their incomes, tastes, number) moves the buyers' curve D. A change that affects what sellers offer at each price (their costs, the number of sellers, a faster machine) moves the sellers' curve S. Unit 2 lists these causes in full; for now, the test is the same every time.