
A delivery van uses 6 gallons of fuel per 100 miles at 20 miles per hour, only 3.4 gallons at 50, and 4.4 again at 70. Plot those numbers and the curve falls, bottoms out and rises: a U. The shape tells you more than any single number does: where the van is most fuel-efficient, and how fast things change on either side. Economics reads graphs the same way, and its main tool for that is the slope.
Rise over run
The slope of a line measures how steeply it rises or falls. Pick two points on the line. The rise is the change in the vertical value between them; the run is the change in the horizontal value. Then
Subtract in the same order on top and bottom: second point minus first point for both. The slope tells you how much the vertical variable changes for each one-unit change in the horizontal variable.
Worked example: the slope of a straight line. A line passes through (20, 8) and (60, 4).
- Rise (vertical change, second minus first): .
- Run (horizontal change, in the same order): .
- Divide: .
- Check the sign. The line falls as you move right, so a negative slope makes sense. For each one unit across, the vertical value falls by 0.1.
Dividing the other way, , is the common slip. Rise always goes on top.
Reading the sign
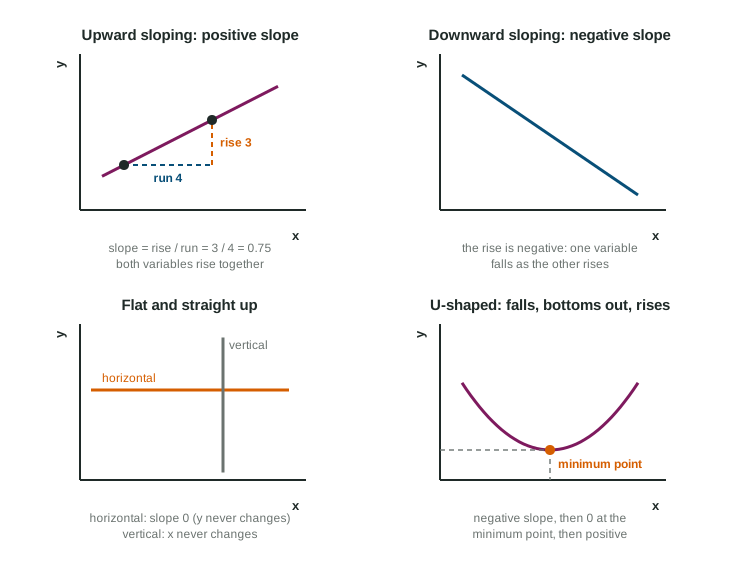
| Shape | Slope | What it says |
|---|---|---|
| Rises to the right | positive | both variables rise together: a direct relationship |
| Falls to the right | negative | one rises as the other falls: an inverse relationship |
| Horizontal | 0 | the vertical value stays the same whatever the horizontal value |
| Vertical | too steep for a number | the horizontal value stays the same whatever the vertical value |
Steepness is the size of the slope, ignoring its sign. A line with slope -3 is steeper than one with slope -0.33, even though both fall. When a question asks which line is "steeper", compare sizes; when it asks whether the relationship is direct or inverse, look at the sign.
Straight lines and curves
A straight line has one slope everywhere: pick any two points and you get the same rise over run. A curve is different. Its slope changes as you move along it. A curve that gets steeper as it goes up has a slope that grows; one that flattens out has a slope that moves toward 0. To describe a curve's slope over a range, take two points at the ends of the range and work out rise over run between them.
U-shaped curves and the minimum point
A U-shaped curve falls, reaches a lowest point, then rises. Its slope is negative on the left side, positive on the right side, and 0 at the bottom, the minimum point, where the curve stops falling and starts rising. The van's fuel curve is U-shaped with its minimum point at 50 miles per hour.
Worked example: slopes on a U-shaped curve. The van uses 6.0 gallons per 100 miles at 20 miles per hour, 3.8 at 40, 3.4 at 50 and 4.4 at 70.
- From 20 to 40: rise , run , slope . Negative: the curve is falling.
- From 50 to 70: rise , run , slope . Positive: the curve is rising.
- Minimum point: 50 miles per hour, the lowest fuel use, where the slope changes from negative to positive.
Several important curves in this course are U-shaped, and the exam checks that you put their minimum points in the right place. Get used to spotting where a curve stops falling and starts rising, and to reading which way the slope runs on each side.