
The owner of Calle Verde Taco Truck tries a different price each week and writes down how many tacos she sells per day. At $1 she sells 120, at $3 she sells 80, at $5 only 40. The list is accurate, but the pattern is easier to see on a graph. Every graph in this course, from the first one in Unit 1 to the last one in Unit 6, is built from the same few parts: two labeled axes and points placed by reading them.
Two axes, each with a label
A graph compares two variables. One goes on the horizontal axis, also called the x-axis, which runs left to right along the bottom. The other goes on the vertical axis, the y-axis, which runs up the left side. The two axes meet at the origin, the point (0, 0). Values grow as you move right along the horizontal axis and as you move up the vertical axis.
Each axis gets a label: the name of the variable, with its units when it has them ("Tacos sold per day", "Price per taco ($)"). On the exam, a graph with an unlabeled axis does not earn the graph point, even when every curve is right. Make labeling the first thing you do, before you draw a single line.
Economics has a convention for market graphs that you will use hundreds of times: quantity goes on the horizontal axis and price goes on the vertical axis. Later graphs use the same idea with other names ("Price and cost" for a firm, "Wage" and the number of workers for a job market), but the quantity always runs across the bottom.
Ordered pairs
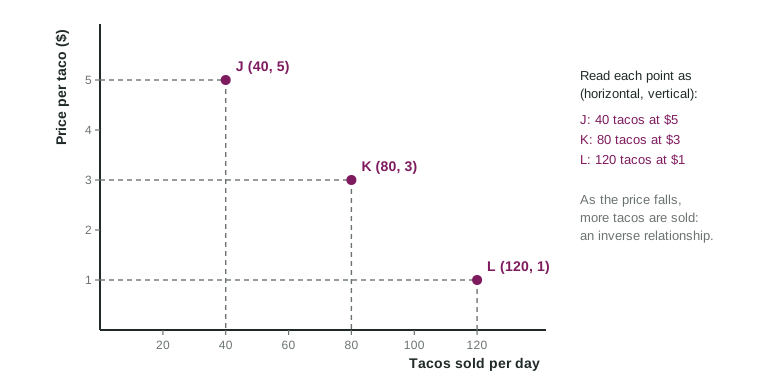
A point on a graph is named by an ordered pair, written (x, y): first the horizontal value, then the vertical value. The order matters. With tacos across and price up, (80, 3) means 80 tacos at $3. Written the other way, (3, 80), it would mean 3 tacos at $80, a completely different point.
To plot a point, start at the origin, move right to the horizontal value, then up to the vertical value. To read a point that is already drawn, go the other way: drop a line straight down to the horizontal axis and run a line straight across to the vertical axis. The dashed lines in the figure do exactly that. Exam graphs use the same dashed lines to show where a point's values sit on each axis.
Worked example: from a table to a graph. The taco truck's table gives these rows: $1 and 120 tacos, $2 and 100, $3 and 80, $4 and 60, $5 and 40.
- Label the axes. Tacos sold per day across the bottom, Price per taco ($) up the side.
- Choose scales. Tacos run from 40 to 120, so mark the horizontal axis in steps of 20 up to 140. Prices run from $1 to $5, so mark the vertical axis in steps of 1.
- Write each row as an ordered pair, horizontal value first: (120, 1), (100, 2), (80, 3), (60, 4), (40, 5).
- Plot each pair: right to the tacos value, then up to the price.
- Read the pattern. The points fall as you move right: lower prices go with more tacos sold.
The most common slip is writing the pair in the order the table lists its columns. Check which variable is on the horizontal axis and put that value first.
Direct and inverse relationships
Once the points are plotted, look at the direction they run.
| Direct (positive) relationship | Inverse (negative) relationship | |
|---|---|---|
| What happens | both variables rise together, or fall together | one rises as the other falls |
| On the graph | points rise to the right | points fall to the right |
| Example | hours worked and weekly pay | price per taco and tacos sold |
A direct relationship means the two variables move in the same direction. An inverse relationship means they move in opposite directions. The taco table shows an inverse relationship: as the price rises from $1 to $5, tacos sold fall from 120 to 40. The words "positive" and "negative" are used too, and they mean the same things.
Comparing two points
Many exam questions ask what changed between two points. Compare the first numbers to see what happened to the horizontal variable and the second numbers for the vertical one. From K (80, 3) to L (120, 1), the quantity rose from 80 to 120 and the price fell from $3 to $1. Say both changes, with their directions, every time.
Keep these habits from the start: label both axes, put the horizontal value first, and use dashed lines to show a point's values on the axes. Each one is a point a reader looks for on a graph.