
You were ready to pay $80 for a concert ticket and got it for $50, so you walked away $30 better off. The band would have played for less than it was paid, so it is better off too. Voluntary trade makes both sides gain. This topic shows where a market settles and how to measure those gains on a graph.
Market equilibrium
Put demand and supply on one graph. They cross at the market equilibrium: the equilibrium price is the one price at which the quantity buyers want equals the quantity sellers offer, and that amount is the equilibrium quantity. At that price the market clears: every buyer willing to pay it finds a seller, and every seller willing to accept it finds a buyer. Mark it the way readers score it: dashed lines from the crossing to both axes, labeled PE and QE.
Prices do a second job. When a frost cuts the coffee harvest, the higher price tells growers elsewhere to plant more coffee and tells cafes to serve more tea. Without anyone giving orders, prices act as signals that move land, labor and capital toward the goods buyers value most.
Consumer surplus
Read the demand curve up from any quantity: its height is the most some buyer will pay for that unit. A buyer who pays less than that gains the difference. Consumer surplus (CS) adds up those gains for every unit bought. On a graph it is the area under the demand curve and above the price, from zero out to the quantity traded.
Producer surplus
Read the supply curve up from any quantity: its height is the least a seller will accept to supply that unit. A seller who receives more than that gains the difference. Producer surplus (PS) is the area above the supply curve and below the price, out to the quantity traded.
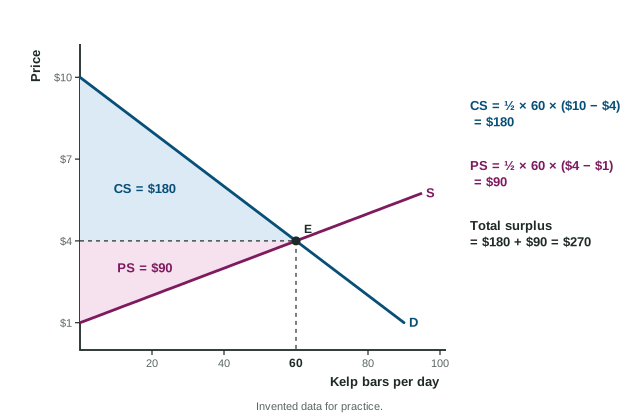
Worked example: surplus in the kelp bar market. In Port Ancel, an invented harbor town, demand for kelp bars is a straight line that reaches zero at $10, and supply is a straight line that starts at $1 (invented data). Quantities per day: at $3, 70 demanded and 40 supplied; at $4, 60 and 60; at $5, 50 and 80.
- Equilibrium. At $4, 60 are demanded and 60 supplied: PE = $4, QE = 60.
- Consumer surplus. A triangle with base 60 and height from $4 up to $10: .
- Producer surplus. A triangle with base 60 and height from $1 up to $4: .
- Total surplus. .
The common slips: forgetting the one half (a rectangle instead of a triangle), measuring producer surplus down to $0 when supply starts at $1, and using a quantity other than the one traded.
Total surplus is largest at equilibrium
Total surplus is consumer surplus plus producer surplus: the whole gain from trade, the area between demand and supply out to the quantity traded. In a competitive market with nothing else going wrong, it is as large as it can be at the equilibrium quantity.
- Fewer units than QE. Some units that buyers value above their cost are never traded, so their gain is lost.
- More units than QE. Past the crossing, supply lies above demand: each extra unit costs more to produce than any buyer will pay for it, so producing it subtracts from total surplus.
| Area | Top edge | Bottom edge | Runs out to |
|---|---|---|---|
| Consumer surplus | Demand | The price buyers pay | Quantity traded |
| Producer surplus | The price sellers receive | Supply | Quantity traded |
| Total surplus | Demand | Supply | Quantity traded |
This is why later topics measure every policy by what it does to these areas. The next topic follows them when a curve shifts; government policies in this unit change who gets which part of the total, and can make the total smaller.