
When a city's factories hire again and paychecks rise, the steakhouse downtown fills up and the bus company sells fewer monthly passes. When a cafe raises the price of coffee, it sells more tea and less cream. Price elasticity of demand measures how buyers respond to a good's own price. Two more elasticities measure how they respond to their income and to the price of another good, and for both, the sign is the most important part of the answer.
Income elasticity of demand
The income elasticity of demand is the percent change in quantity demanded divided by the percent change in buyers' income, with prices held the same. Keep the sign:
- Positive: a normal good. More income, more demand. If the value is between 0 and 1, demand grows more slowly than income (bread, toothpaste). If it is above 1, demand grows faster than income (restaurant meals, travel).
- Negative: an inferior good. More income, less demand, because buyers switch to something they prefer (bus passes when people can afford cars, store-brand cereal).
Worked example: three goods when incomes rise. In Wexmoor, an invented town, average income rises from $4,000 to $4,400 a month (invented data). Monthly purchases per household change as follows: restaurant meals 4 to 5, bus passes 20 to 19, loaves of bread 50 to 51.
- Percent change in income.
. - Restaurant meals. , so : normal, and demand grows faster than income.
- Bus passes. , so : inferior.
- Bread. , so : normal, growing slowly.
Dropping the minus sign on bus passes turns an inferior good into a normal one and loses the point.
Cross-price elasticity of demand
The cross-price elasticity of demand is the percent change in quantity demanded of one good divided by the percent change in the price of another. Keep the sign:
- Positive: substitutes. The price of coffee rises and buyers switch to tea, so tea sales rise: both changes go the same way.
- Negative: complements. The price of coffee rises, people drink less coffee, so they buy less cream: the changes go opposite ways.
- Near zero: the goods are unrelated (coffee and postcards).
Worked example: a cafe raises the price of coffee. The Lantern Cafe raises coffee from $2.50 to $3.00, a rise (invented data). Tea sales go from 100 to 110 cups (+10%); cream from 200 to 188 pitchers (−6%).
- Tea. . Positive: substitutes.
- Cream. . Negative: complements.
Read the sign, then the size
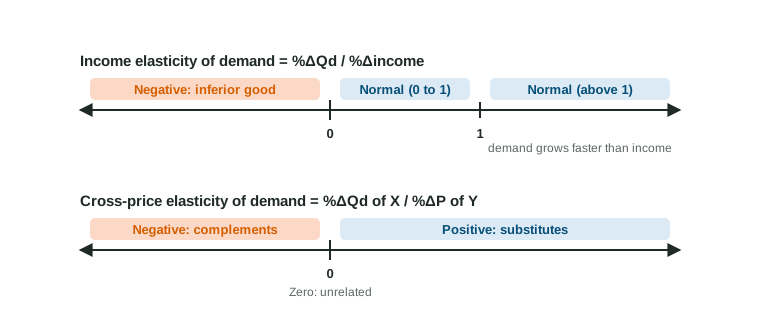
Price elasticity of demand is negative for nearly every good, so its sign tells you nothing new and you read its absolute value. Income and cross-price elasticity can be either sign, and the sign is the information. The size then tells you how strong the link is: a cross-price elasticity of 2 means close substitutes; 0.1 means weak ones.
| Elasticity | Divide the percent change in quantity demanded by | Read |
|---|---|---|
| Price elasticity of demand | the percent change in the good's own price | absolute value against 1 |
| Income elasticity | the percent change in income | sign: + normal, − inferior |
| Cross-price elasticity | the percent change in another good's price | sign: + substitutes, − complements |
The same idea works for any determinant of demand: a percent change in quantity over a percent change in whatever caused it. You can also run it forward: with an income elasticity of 1.8, a 5% rise in income raises the quantity demanded by about .
Linking it to a graph
These elasticities describe shifts of demand. When the price of coffee rises, the demand curve for tea (a substitute) shifts right. When incomes fall, demand for an inferior good such as used cars shifts right too. Name the elasticity's sign, then draw the shift it implies.