
Rice in Dornia, an invented small country, sells for $5 a ton while its ports are closed. When the country opens to trade, rice sells for $3, the price on the world market. Dornian families save money, some Dornian farms shrink, and ships unload 40 tons a day. Then the government adds a $1 tariff. Who wins, who loses, and by how much can all be read off one supply and demand graph of the domestic market.
Opening to trade: the world price
A small country's buyers and sellers are too few to move the price on the world market, so the country takes the world price as given. Draw its domestic demand and supply as usual and add a horizontal line at the world price, labeled PW.
- World price below the domestic price. The price falls to PW. Buyers want more, domestic firms supply less, and imports fill the gap: quantity demanded minus domestic quantity supplied at PW.
- World price above the domestic price. The price rises to PW. Domestic firms supply more, buyers want less, and the country exports the difference: quantity supplied minus quantity demanded at PW.
Why would the world price be lower? Because producers elsewhere make the good at a lower opportunity cost: they have a comparative advantage in it. Trade lets each country buy what others make cheaply and put its own resources where it has the comparative advantage.
Who gains from trade
When a country imports, the lower price raises consumer surplus and lowers producer surplus. Consumers gain more than producers lose, so total surplus rises: the extra is a triangle between the domestic curves and the world price, over the imports. When a country exports, the higher price raises producer surplus and lowers consumer surplus, and again total surplus rises. In both cases some people lose, which is why trade is argued about even though the total rises.
Worked example: Dornia opens to trade. Dornian rice demand and supply per day (invented data): at $3, 70 tons demanded and 30 supplied; at $4, 60 and 40; at $5, 50 and 50. Without trade the price is $5 and 50 tons are traded. The world price is $3.
- Imports at $3: tons.
- Consumer surplus (demand reaches zero at $10): before, ; after, .
- Producer surplus (supply starts at $0): before $125; after, .
- Total surplus rises from $250 to $290. The $40 gain is the triangle .
Read imports from the quantities at the world price, not from the old equilibrium quantity.
A tariff
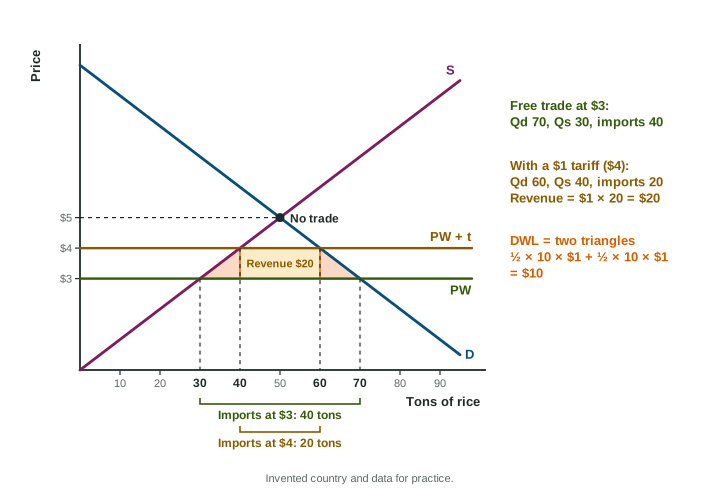
A tariff is a tax on imports. It raises the price in the country by the tariff, to PW + t. At the higher price, domestic firms supply more, buyers want less, and imports shrink.
Worked example: a $1 tariff on rice. The price in Dornia rises from $3 to $4.
- Imports: tons, down from 40.
- Tariff revenue: , the tariff times the imports that remain.
- Deadweight loss: two triangles. Domestic farms now grow tons 31 to 40 at a cost above the world price: . Buyers give up tons 61 to 70 that they valued above the world price: another $5. Total $10.
- Who gains: domestic producers (surplus up from $45 to $80) and the government ($20). Buyers lose more than both gain: consumer surplus falls from $245 to $180.
| Area (figure) | Goes to |
|---|---|
| Between PW and PW + t, left of domestic quantity supplied | Domestic producers |
| Triangle between supply and PW, from old to new domestic output | Deadweight loss |
| Rectangle between PW and PW + t over the remaining imports | Government (tariff revenue) |
| Triangle between demand and PW, from new to old quantity demanded | Deadweight loss |
Import quotas
An import quota limits the quantity that may be imported. If Dornia allowed only 20 tons a day, the price would rise until the gap between quantity demanded and domestic quantity supplied was 20 tons: $4, the same as the $1 tariff. Domestic output, imports and the deadweight loss match the tariff. The difference is the rectangle: with a quota the government collects no tariff revenue, and that money goes to whoever holds the right to import. You need to know how a quota changes quantities and prices; graphing a quota is not part of the course.