The LD50 is one point on a curve. The whole curve tells you much more: at what dose harm starts, how quickly it grows, and how two substances compare at the small doses people and wildlife actually meet. This page shows how to read a dose-response curve, what the threshold dose and the ED50 are, and why a dose below the LD50 is not automatically safe.
What the curve shows
To build a dose-response curve, researchers give groups of test animals different doses of a substance and record what percent of each group responds. The response can be death, or a nonlethal effect such as illness, slower growth or falling asleep. Dose goes on the horizontal axis, usually in mg per kg of body mass, and the percent responding goes on the vertical axis.
Most curves have an S shape with three parts:
- Flat at the bottom. At low doses, nothing measurable happens. The body can handle or break down a small amount.
- Steep in the middle. Above a certain dose, each increase affects many more individuals. The 50% point sits here.
- Flat at the top. Once nearly every individual responds, larger doses add little.
Threshold dose, LD50 and ED50
| Term | Where on the curve | What it means |
|---|---|---|
| Threshold dose | where the curve leaves zero | the highest dose with no observed response |
| LD50 | 50% on a curve of deaths | the dose that kills half the test group |
| ED50 | 50% on a curve of another effect | the dose that causes that effect in half the group |
A drug can have both: a low ED50 for its useful effect and a much higher LD50. The wider the gap between the two curves, the safer the drug is to use.
Reading two curves
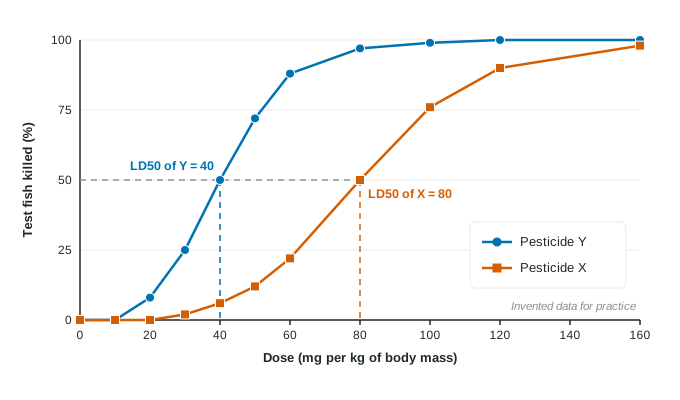
Worked example. Use the figure. Find each pesticide's LD50 and say which is more toxic, and by how much.
Pesticide Y: across from 50% to Y's curve, then down. Y kills 50% of the fish at 40 mg/kg, so its LD50 is 40 mg/kg.
Pesticide X: across from 50% to X's curve, then down. X kills 50% at 80 mg/kg, so its LD50 is 80 mg/kg.
Compare by division:
Thresholds: Y kills 0% at 10 mg/kg and 8% at 20 mg/kg, so it starts between 10 and 20 mg/kg. X kills 0% at 20 mg/kg and 2% at 30 mg/kg, so it starts between 20 and 30 mg/kg.
The general rule: the curve that rises at lower doses, the one further to the left, belongs to the more toxic substance. For a pond that gets only small doses in runoff, the low end of the curve matters most. At 20 mg/kg, Y already kills 8% of fish and X kills none.
Below the LD50 is not "safe"
The LD50 is the dose that kills half the test animals, so a dose just below it can still kill many of them. And death is only one response. A substance can damage the liver, the nerves or a developing fetus at doses far below the dose that kills. That is why regulators look at thresholds for many effects and at long-term studies, not just the LD50.
Some substances are treated as having no threshold: many that cause cancer and the radiation that damages DNA are examples. For them, the risk is assumed to grow from zero with any dose, so no dose is called completely safe, only lower risk.
Curves are also measured in test animals, usually for one short exposure. People differ from rats, and a small dose every day for years can harm in ways a short test never shows.
Using a curve to make a decision
Suppose a town must pick a pesticide for fields that drain into a fish pond. A strong answer uses the data: "Choose X. Its threshold for killing fish is higher (about 20 mg/kg compared with 10 to 20 mg/kg for Y), and its LD50 is twice as high (80 mg/kg compared with 40 mg/kg), so the small doses in runoff kill fewer fish." Name the numbers, name the measure, and say how it leads to the choice.
On the exam
Expect to read a threshold, an LD50 or an ED50 off a graph or a table, compare two substances, and explain what a curve means for a real decision. Always write the dose with its unit, mg/kg.